Scottish boundaries
The onshore transmission network in Scotland is owned by SSEN Transmission and SP Transmission.
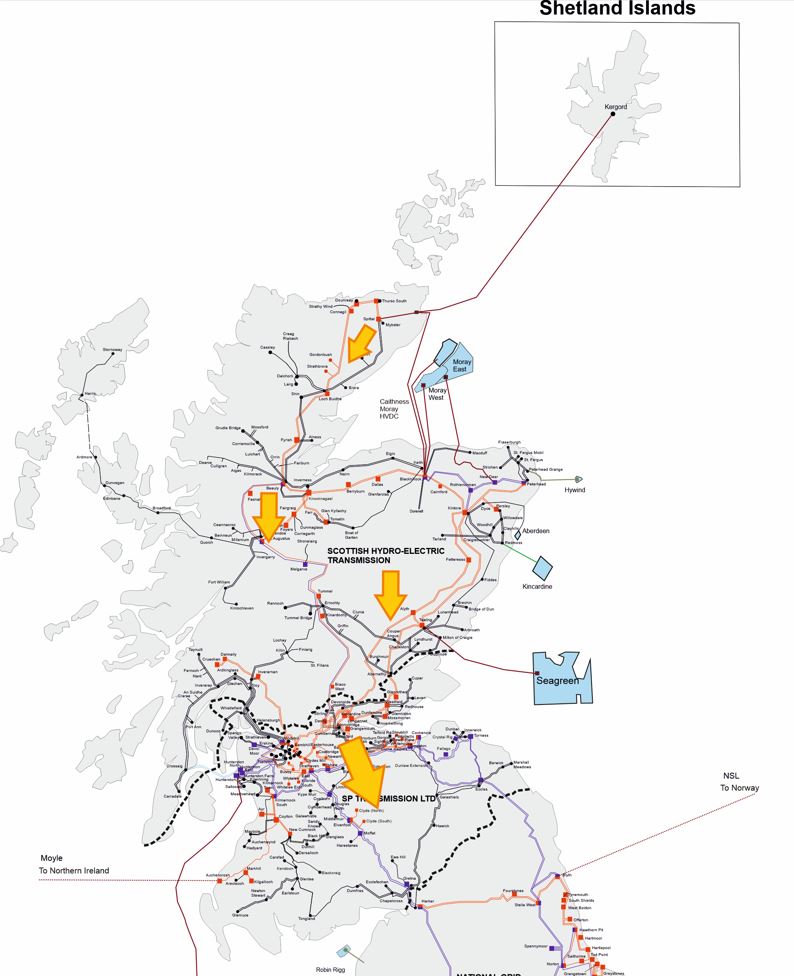
The Scottish NETS is divided into 7 boundaries:
- B0 – Upper North SSEN Transmission
- B1a – North West SSEN Transmission
- B2 – North to South SSEN Transmission
- B3b – Kintyre and Argyll SSEN Transmission
- B4 – SSEN Transmission to SP Transmission boundary (shared by SSEN Transmission and SP Transmission)
- B5 – North to South SP Transmission
- B6 – SP Transmission to NGET (shared by SP Transmission and National Grid Electricity Transmission)
The map below shows the general pattern of power flow directions expected to occur at winter peak in the years to come up to 2036, i.e. power will generally flow from north to south. The arrows in the diagram illustrate power flow directions and are approximately scaled relative to the winter peak flows.
Regional drivers
Scotland has vast natural resources, which means there is a steep projected increase in renewable-generated electricity. However, the transmission system must develop to facilitate this increase in many areas where it’s currently limited.
Over the next 10 years, rapid growth in renewable-generated electricity in Scotland will mainly be attributed to offshore wind. This will cause far greater power transfer requirements across the Scottish boundaries, increasing the network reinforcement needs in some areas. Generation capacity in Scotland heavily exceeds demand, thus Scotland will be expected to export power into England most of the time except during periods of prolonged low wind, where the reverse may occur.
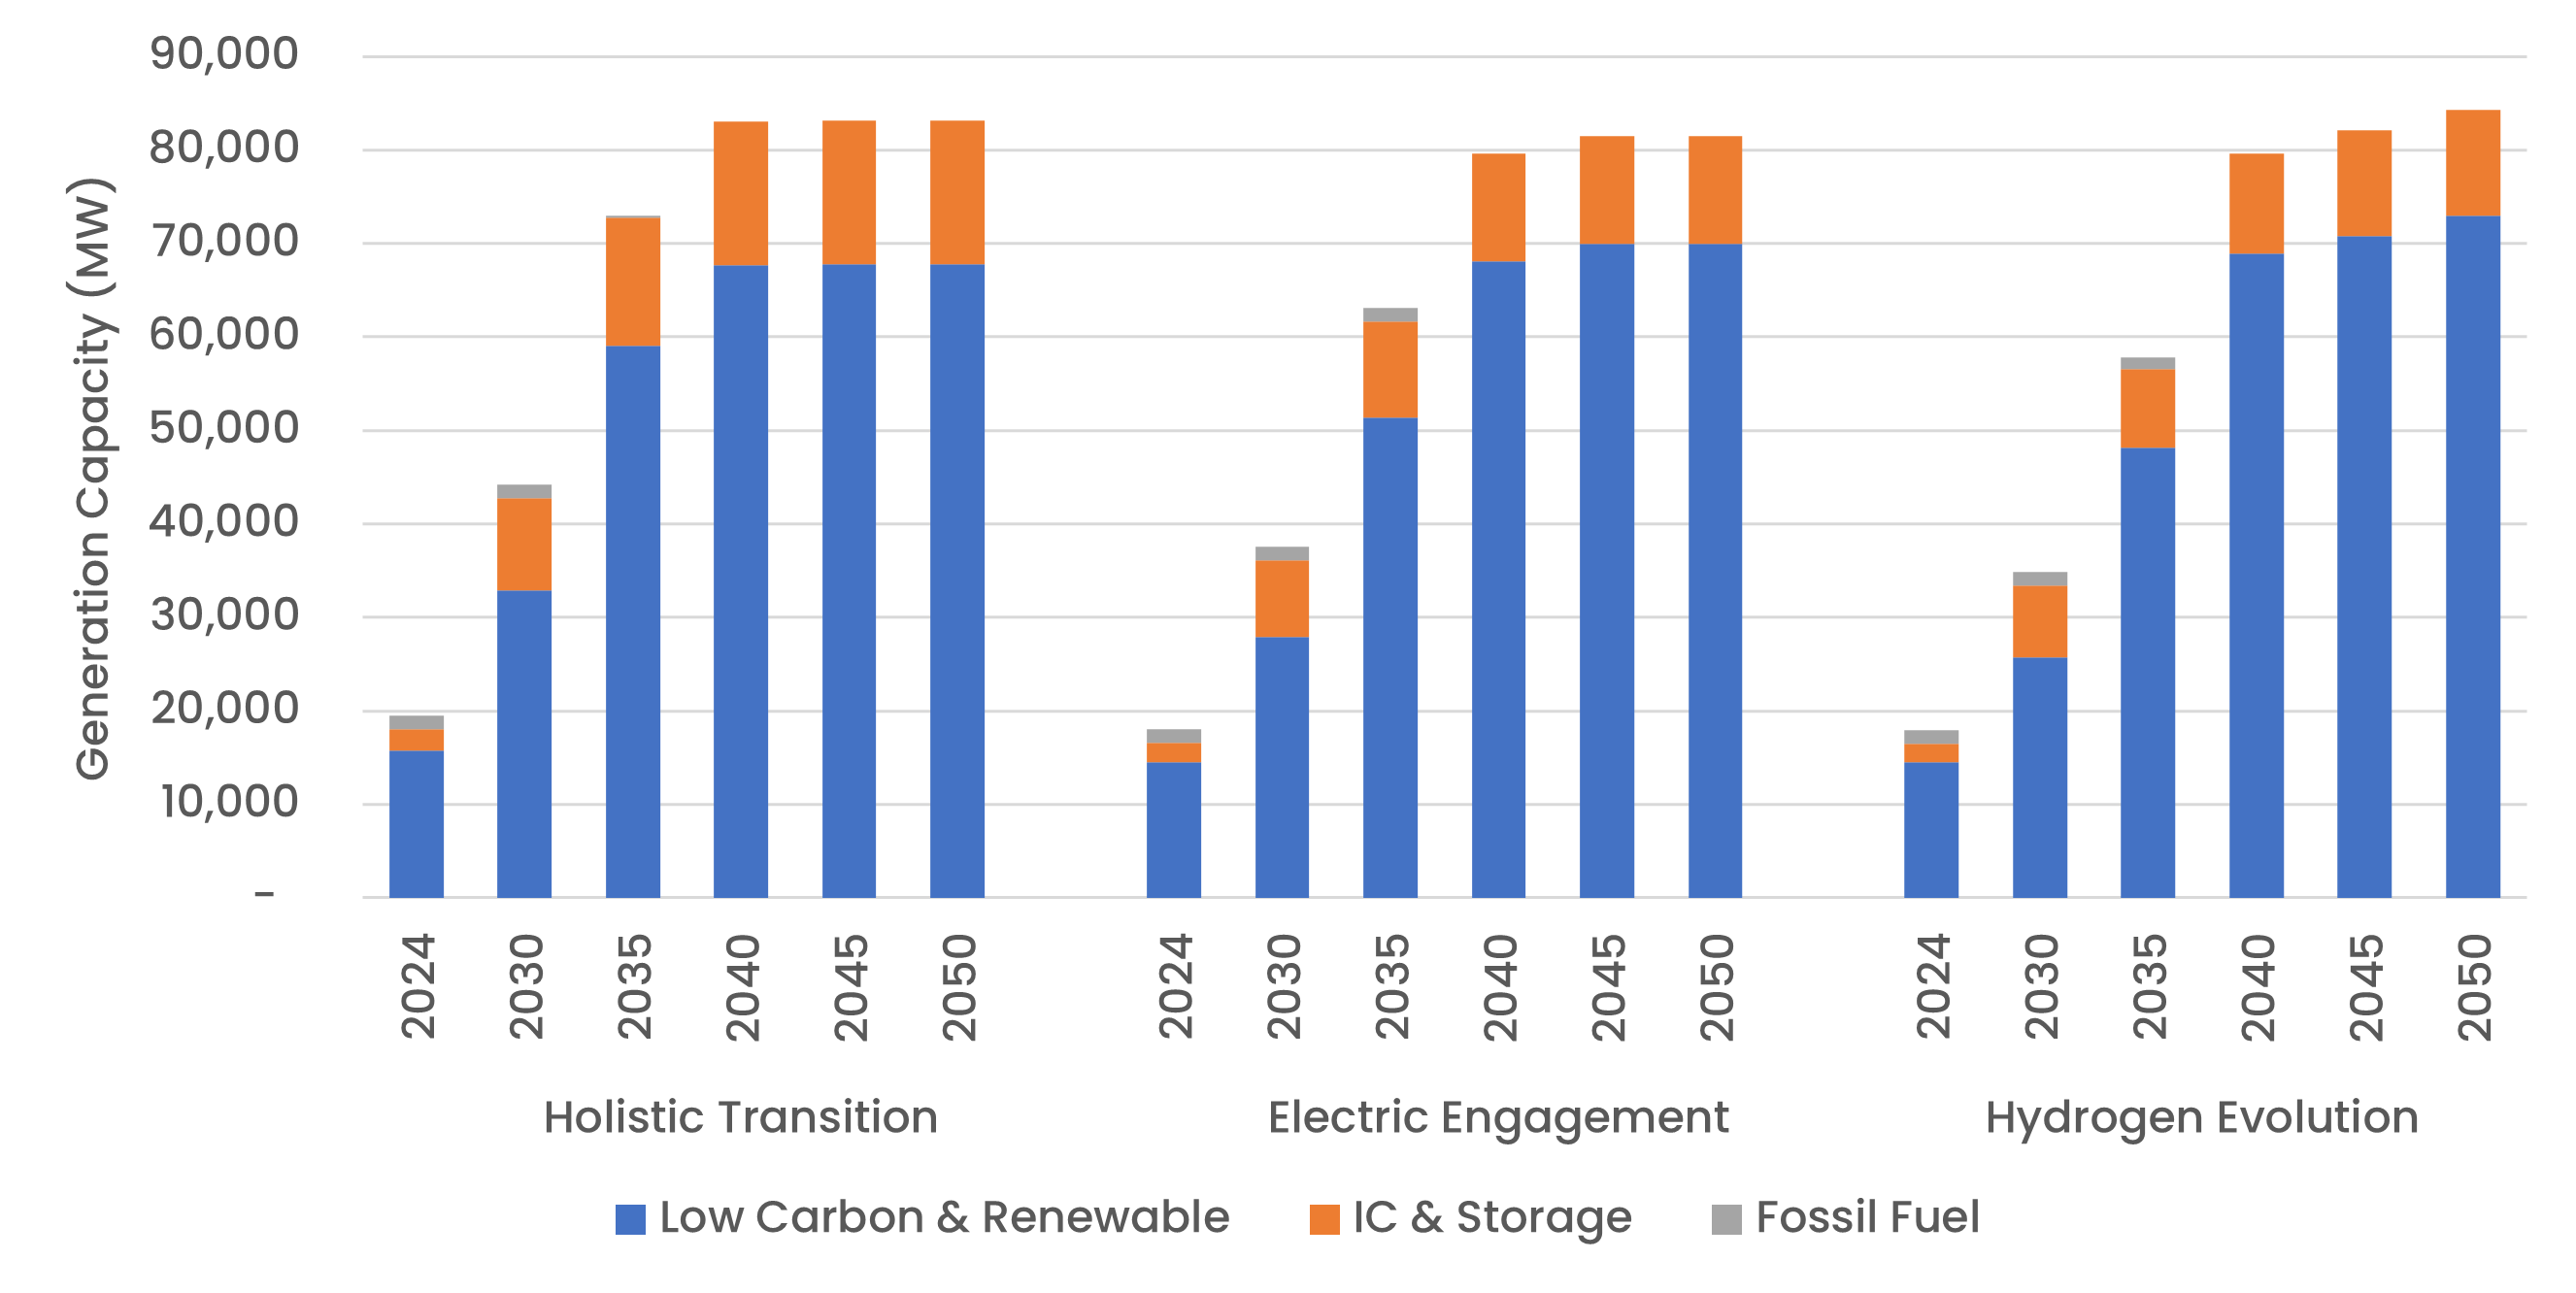
Generation Capacity
Gross Demand
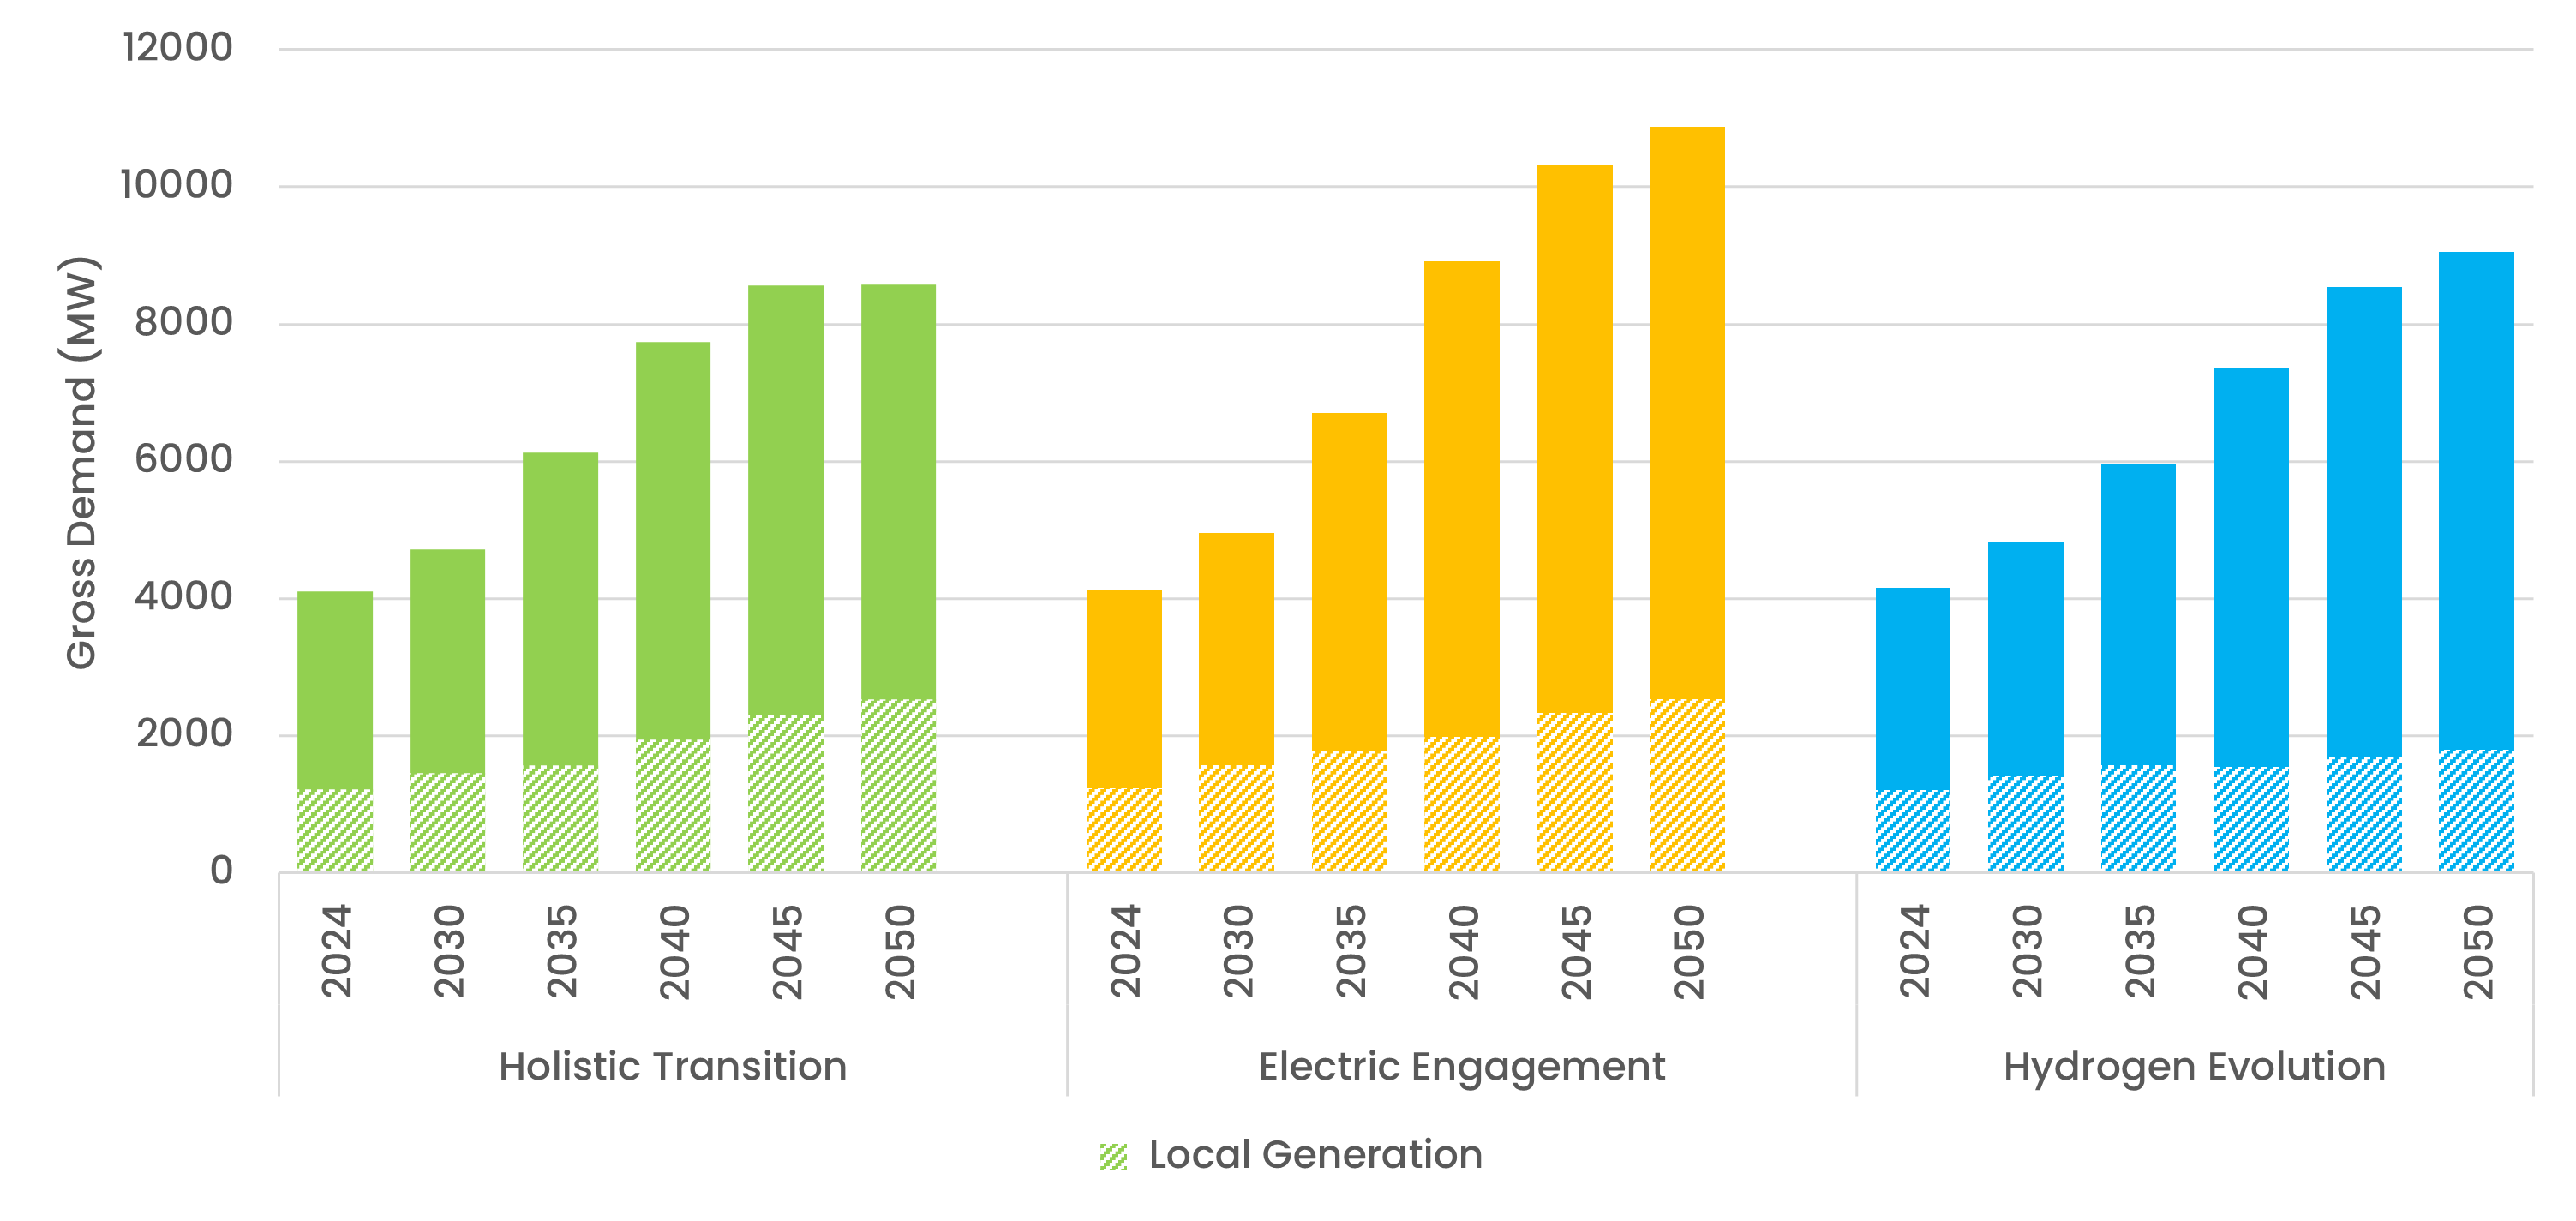
Scotland’s current winter peak gross demand is just over 4 GW and remains below 5GW in 2030 across all FES pathways. The generation capacity in Scotland today is just under 20 GW, this is set to more than double - rising to approximately 45 GW in the Holistic Transition pathway by 2030. Across all three FES pathways, the generation capacity of fossil fuel in Scotland reaches zero between 2035 - 2040.
As Scotland’s renewable generation over the next 10 years increases, so too does the power transfer requirements across the Scottish boundaries (the Scottish NETS boundaries are B0, B1a, B2, B3b, B4 and B5 and B6).
The decline in synchronous generation and prevalence of long transmission lines in Central Scotland can lead to high-voltage issues under light-load conditions. The growth in renewable generation in Scotland will be connecting at the peripherals of the network, leading to limited voltage support locally, new solutions may be required in future to ensure we are able to manage high voltage issues in Central Scotland.
NESO has been running the Constraints Collaboration Project over the past year, where we have been working with industry to develop short-term solutions for reducing constraint costs, in addition to more network and wider market reform coming in the longer-term. One option we are considering is how to avoid curtailing wind in Scotland through increasing the availability of flexible demand in the constrained area. This is still in the initial assessment phase, and we are working closely with industry and government to assess the best way to incentivise new demand sources in locations beneficial for operability. For more information, please visit our webpages.
Boundary regions
Click on the regions below to expand the boundary and understand its capability and challenges.
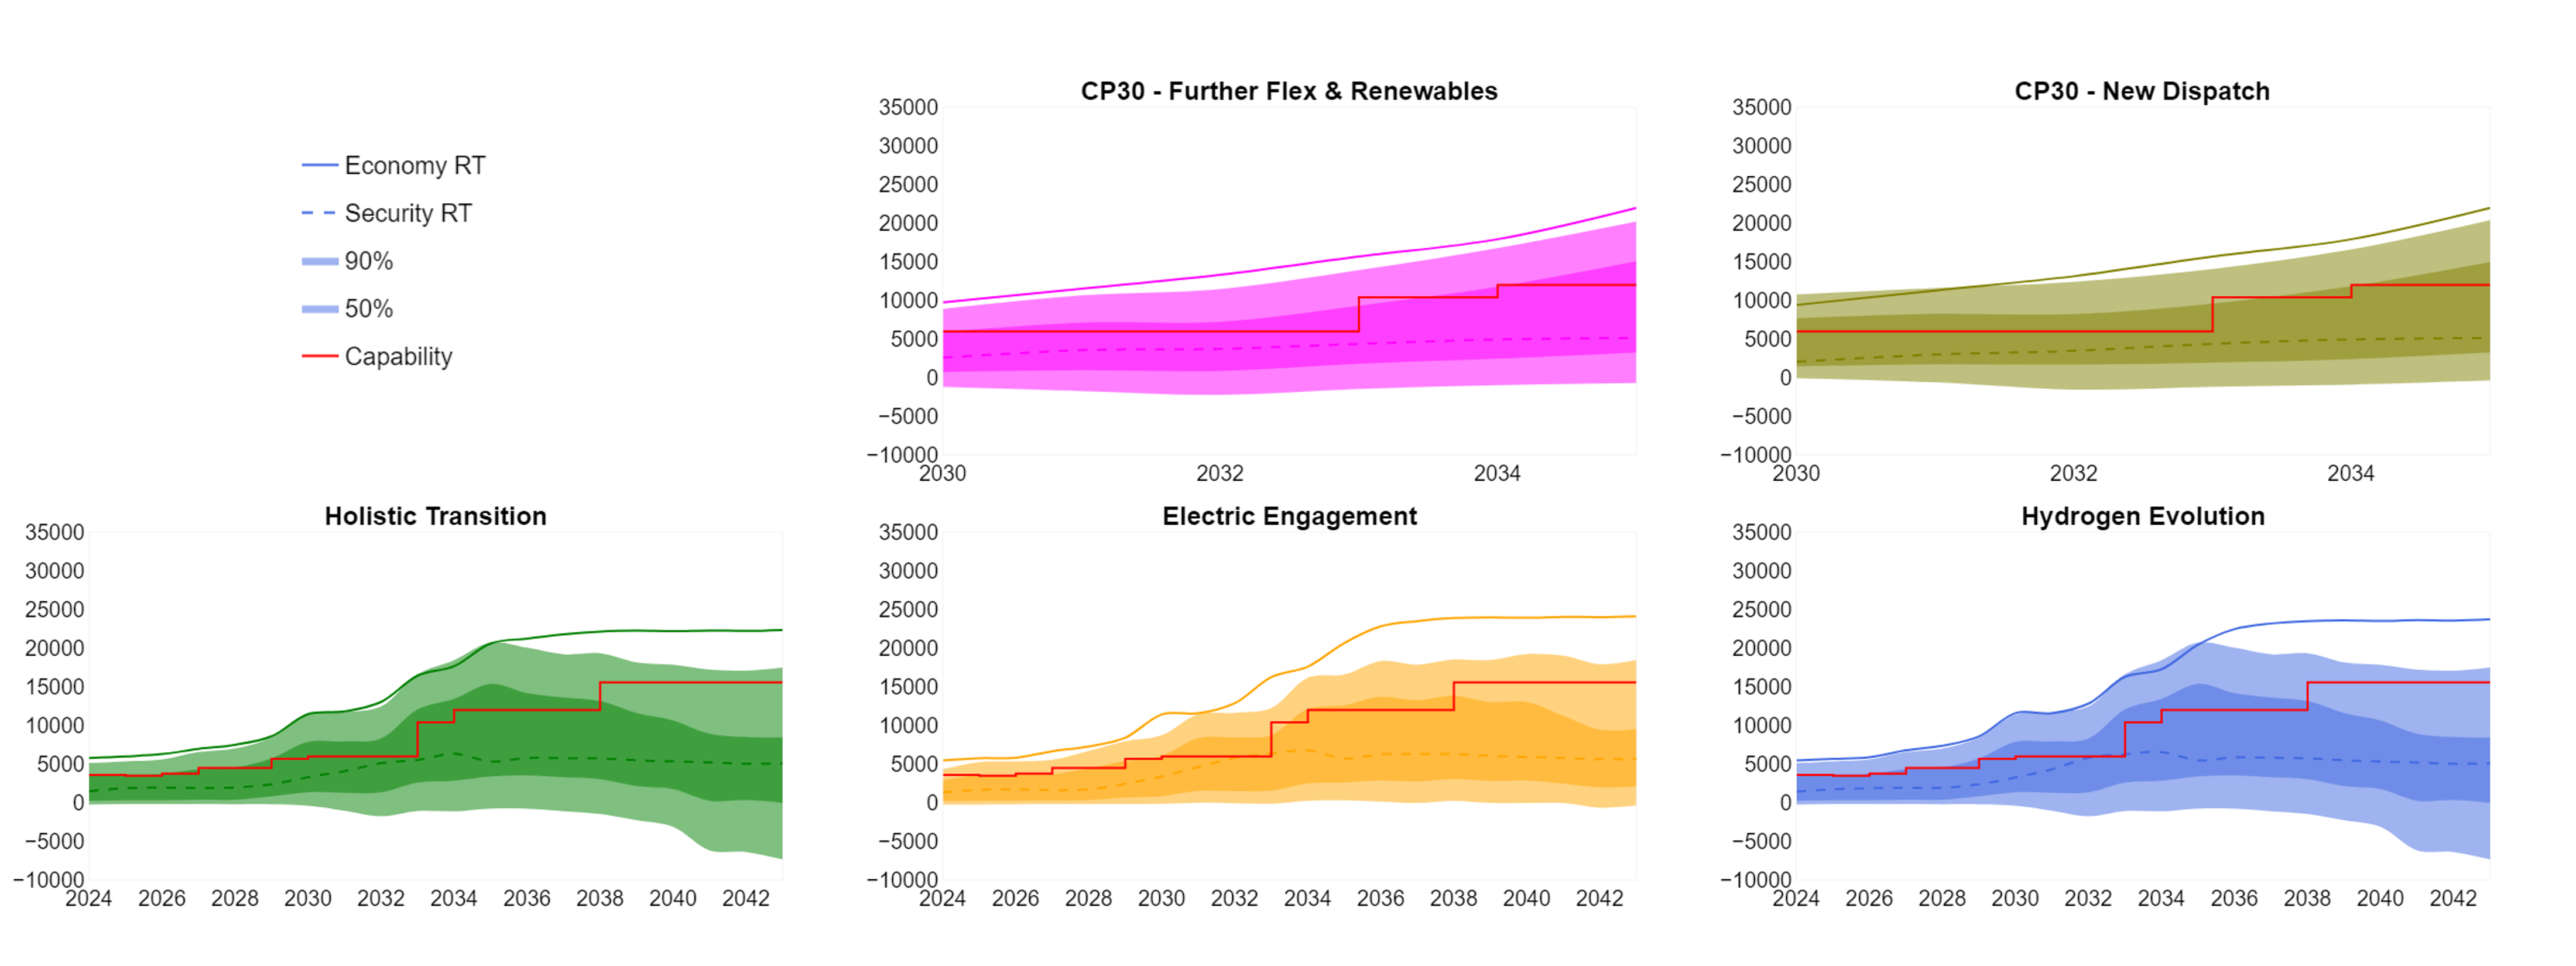
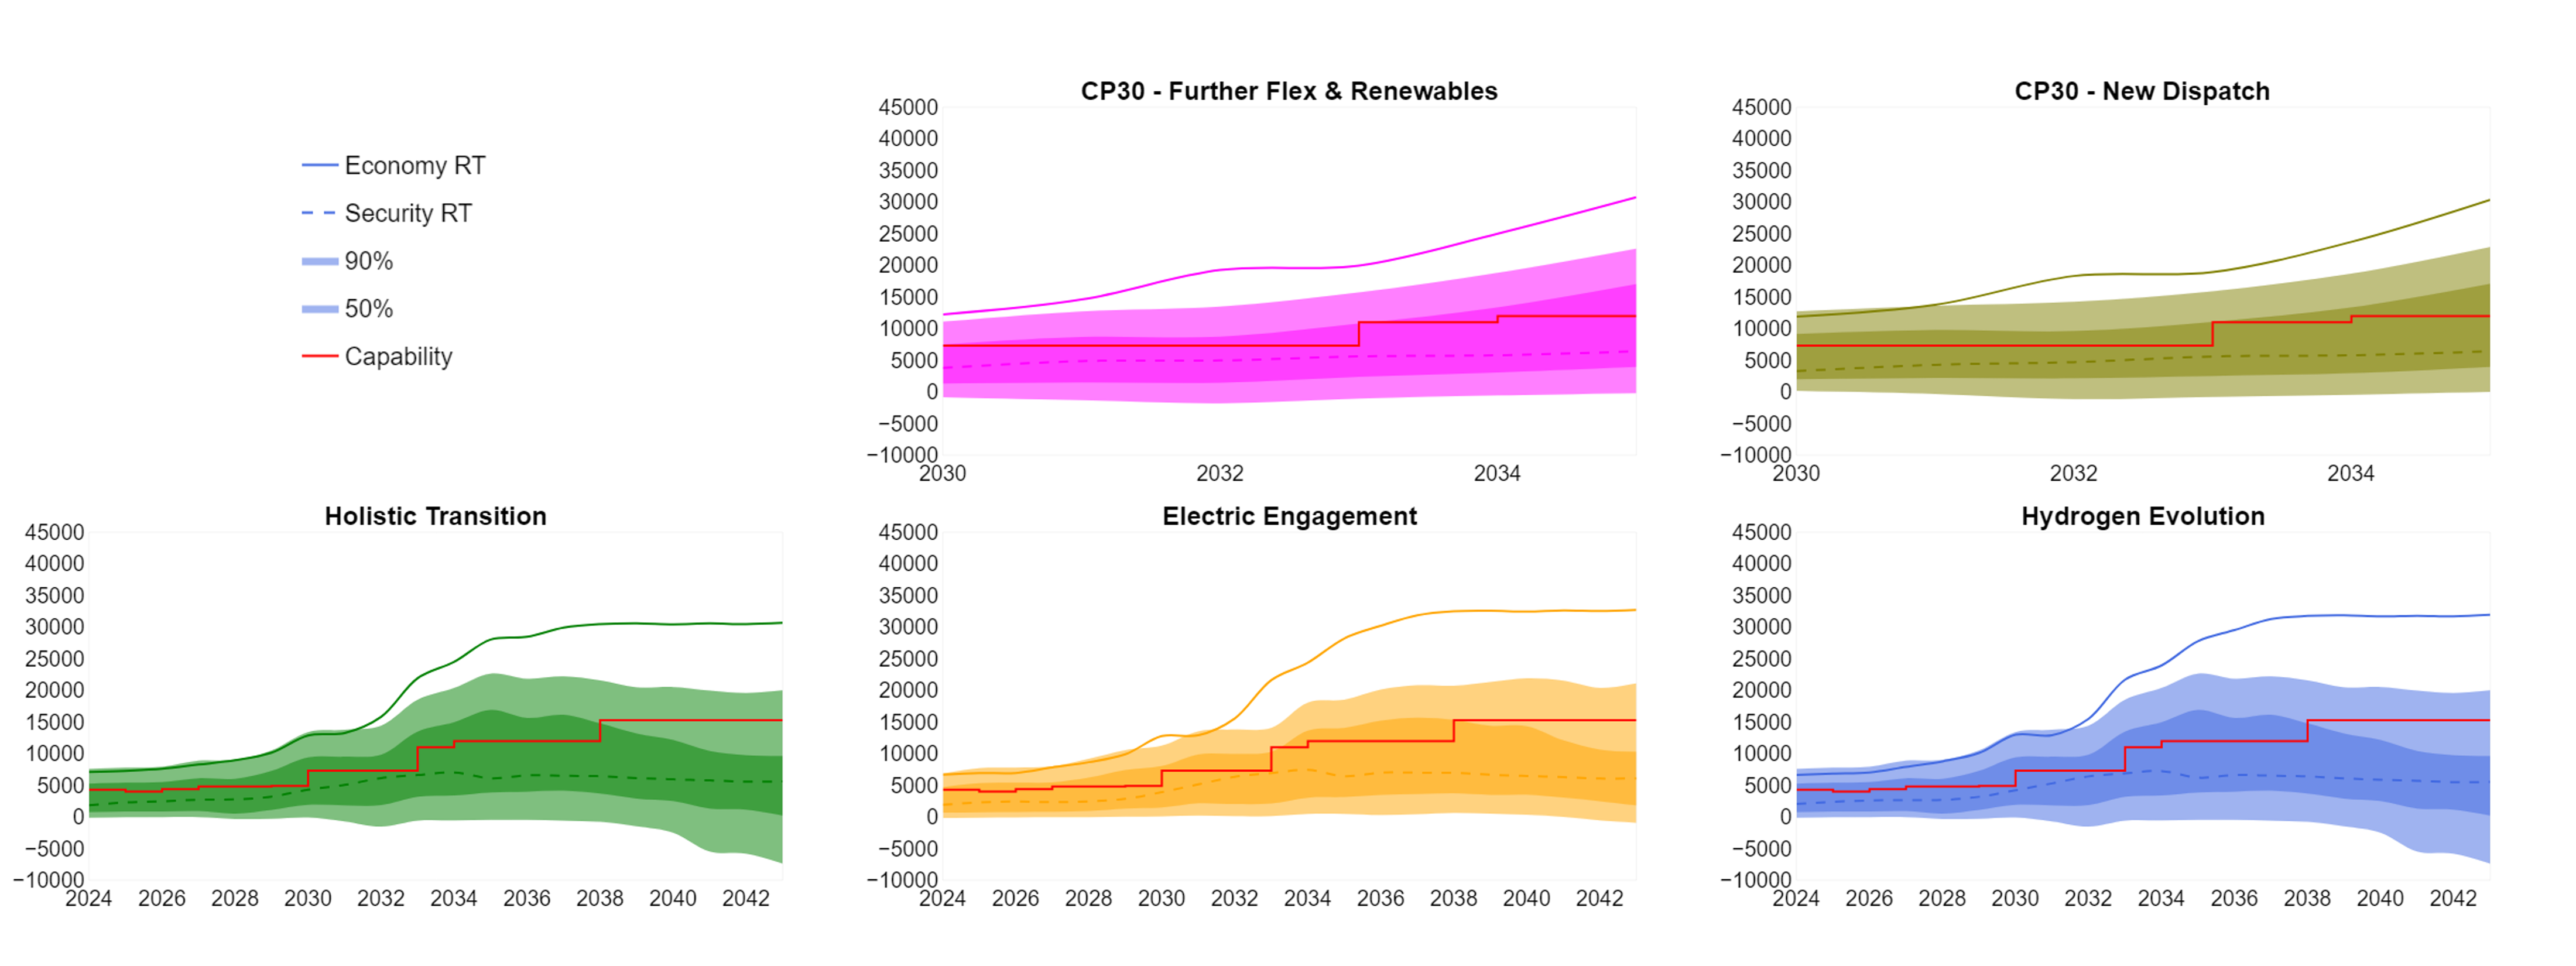
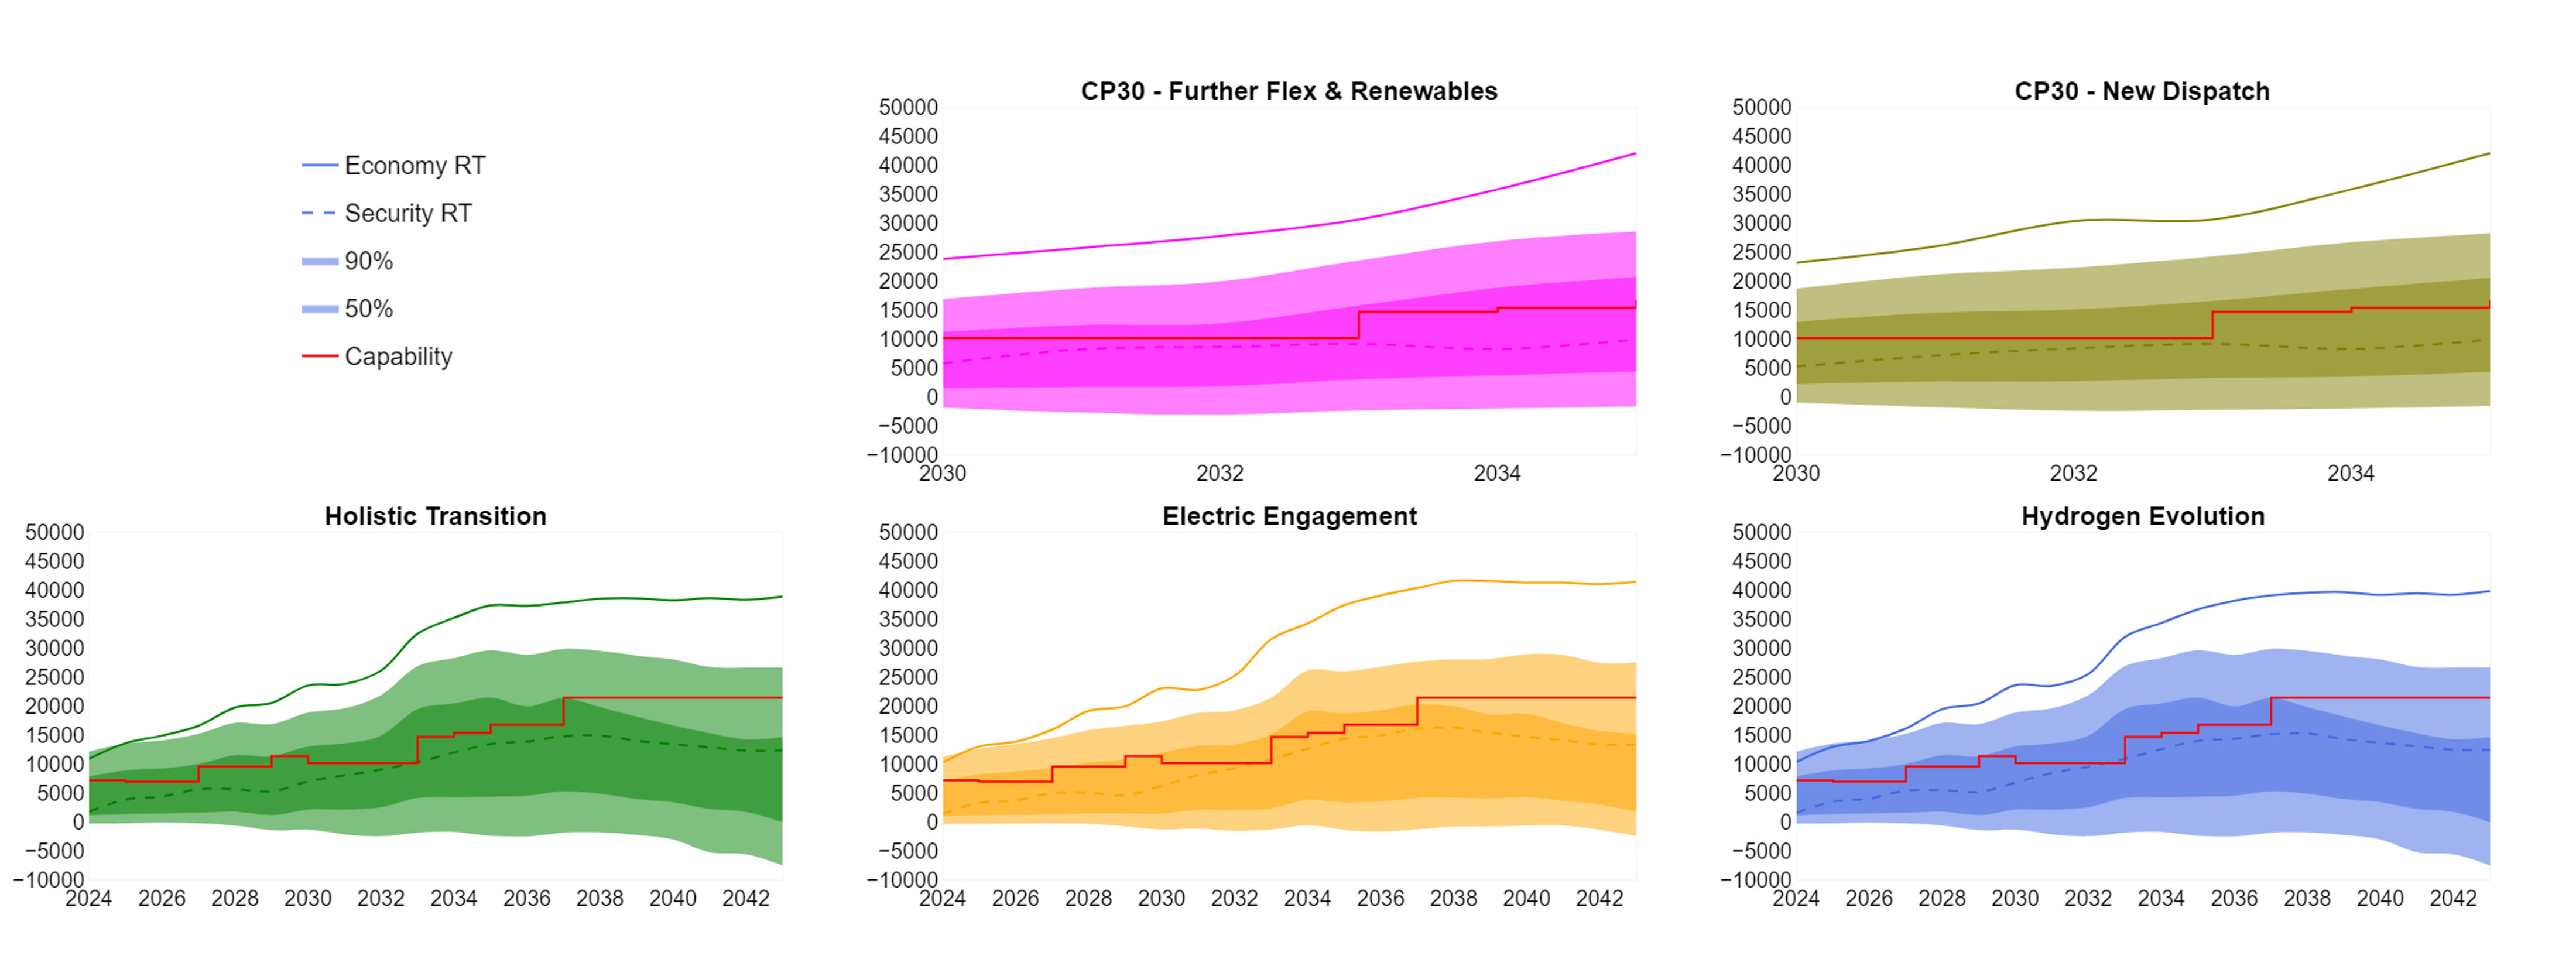
The graphs show a distribution of power flows for each of our Future Energy Scenarios, in addition to the boundary power transfer capability and NETS SQSS requirements for the next 20 years.
Each scenario has different generation and demand so produces different boundary power flow expectations. From applying the methodology in the NETS SQSS for wider boundary planning requirements (as discussed in the previous chapter), we determine for each scenario:
- The economy criteria - solid coloured line
- Security criteria - dashed coloured line
- Current and future NOA capability (where available) - solid red line
The capability line (red line) is based on the recommendations from the Beyond 2030 report. More information about the NOA methodology can be found here. The 50%, 90%, economy required transfer (RT) and Security RT are calculated from the 2023 FES and ETYS processes. Where the NOA transfer capability is not available, there is a red line that provides the transfer capability from ETYS 2022.
Note: Boundary capability line is affected by the generation and demand profiles within each FES background. Therefore, the graphs are provided for indicative purposes only and cannot be directly compared.
The calculations of the annual boundary flow are based on unconstrained market operation, meaning network restrictions are not applied. This way, the minimum cost generation output profile can be found. We can see where the expected future growing needs could be by looking at the power flows in comparison with boundary capability.

View an interactive version of the graph
On each graph, the two shaded areas provide confidence as to what the power flows would be across each boundary:
- The darker region shows 50% of the annual power flows
- The lighter region shows 90% of the annual power flows
From the regions, we can show how often the power flows expected in the region split by the boundary are within its capability (red line). If the capability of the boundary is lower than the two regions over the next 20 years, there might be a need for reinforcements to increase the capability. However, if the line is above the shaded regions, it shows that there should be sufficient capability here and that potentially no reinforcements are needed from a free market power flow perspective until the shaded regions exceed the capability (red line).
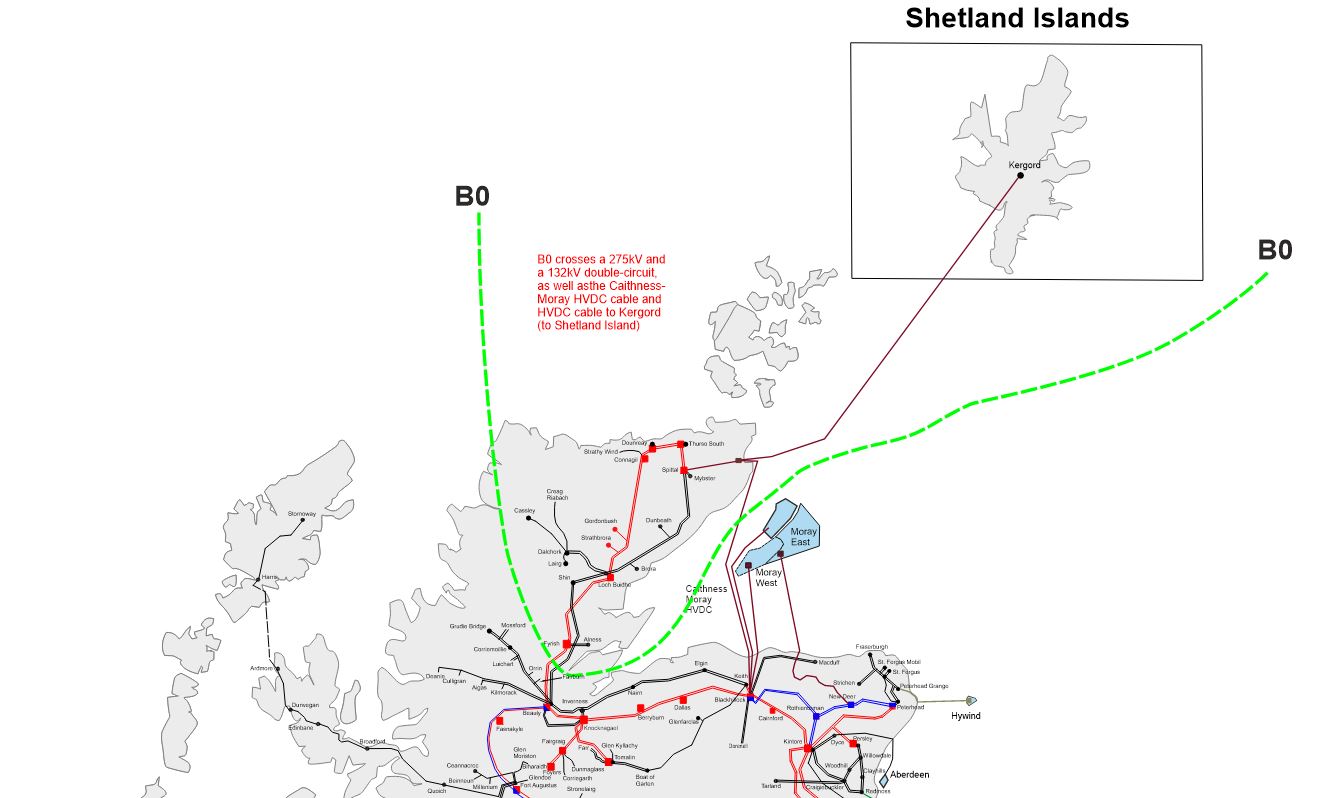
The power transfer through B0 is increasing due to the substantial growth of renewable generation north of the boundary. This generation is primarily centred around both onshore and offshore wind. There is also the prospect of new marine generation resource in the Pentland Firth and Orkney waters in the longer term.
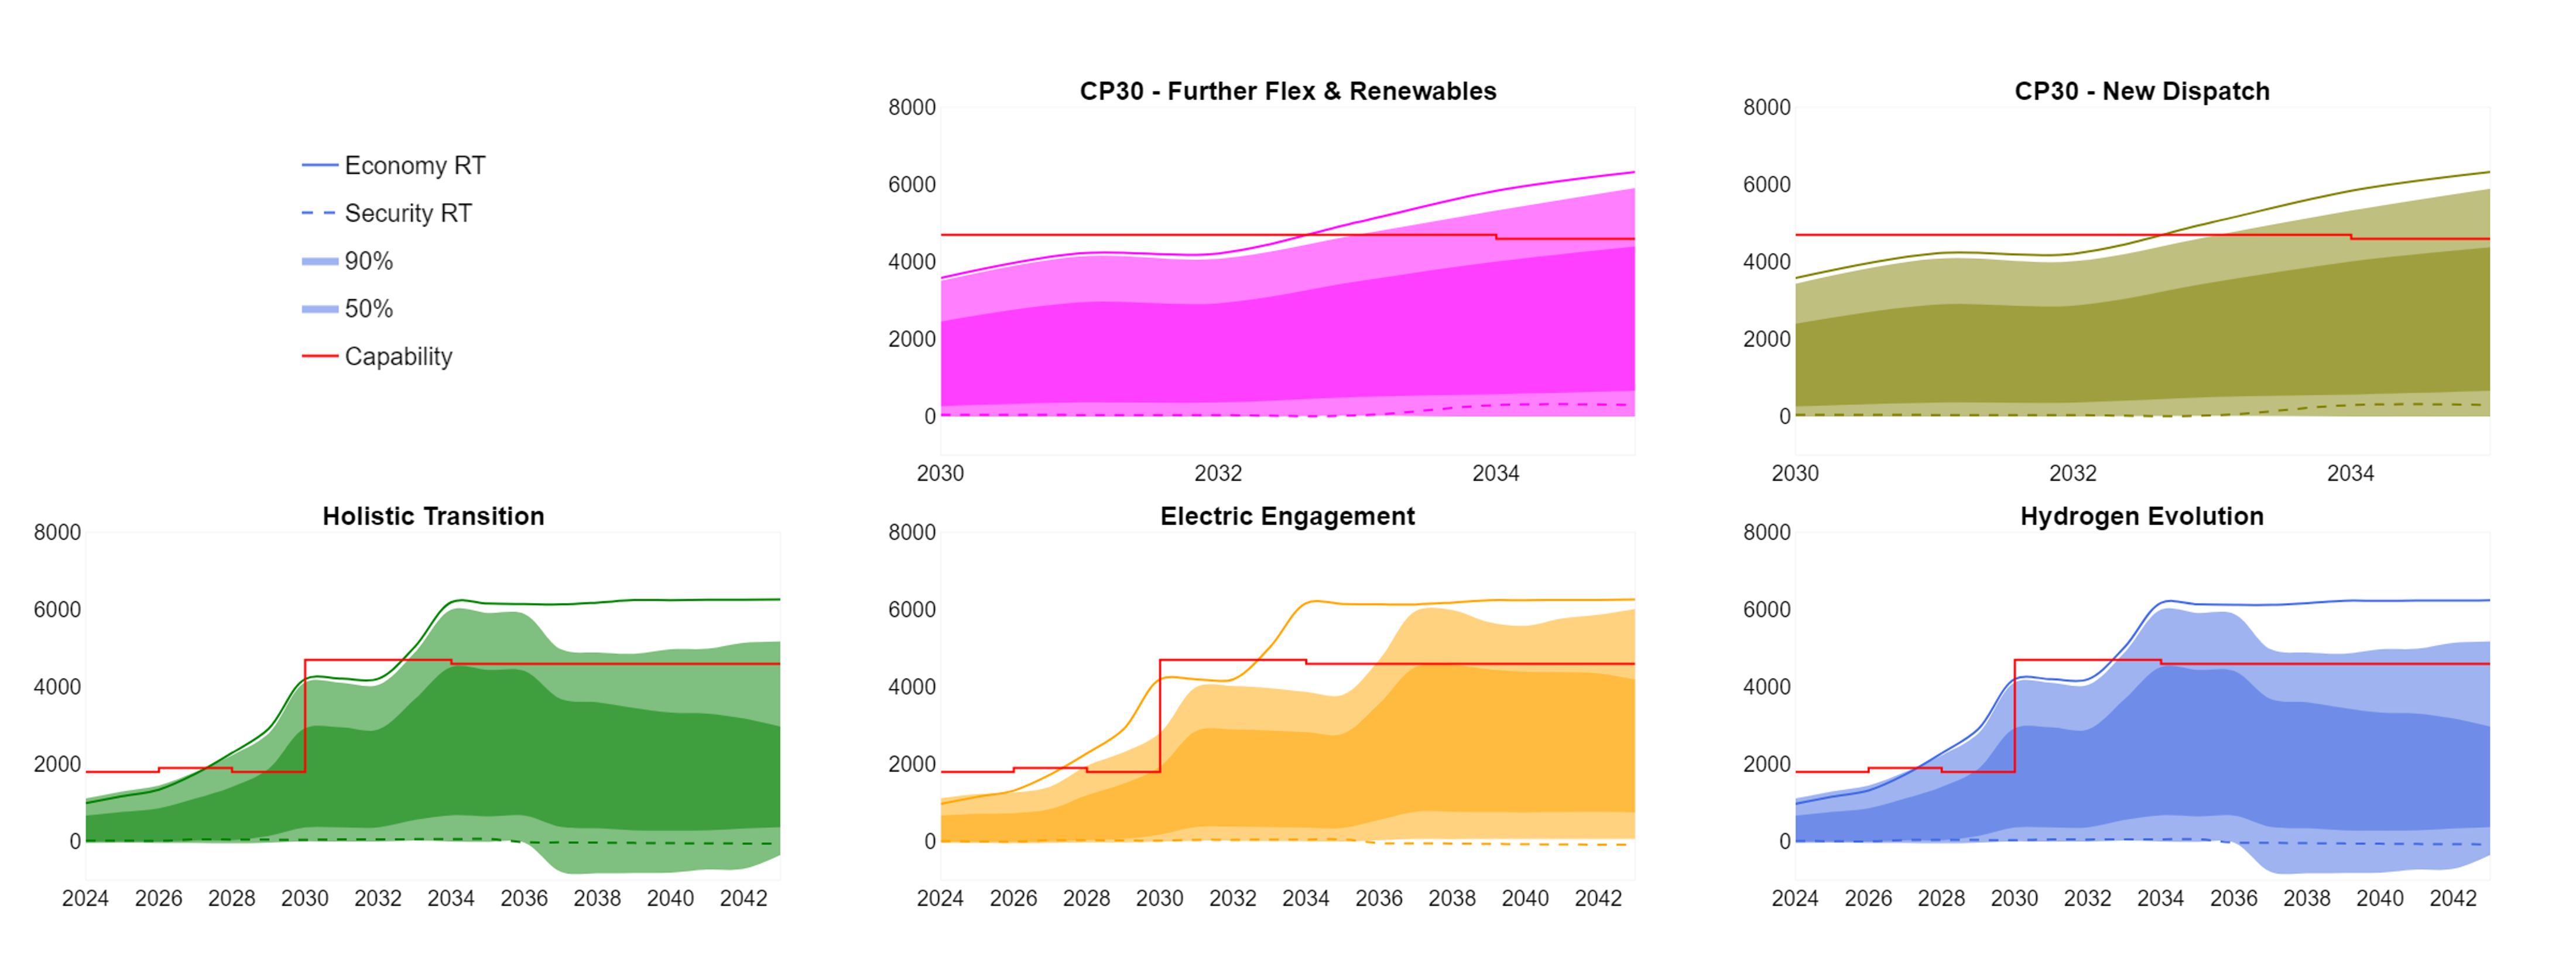
Boundary flows and base capability
View an interactive version of the graph
The capability line (in red) is based on the recommendations from the Beyond 2030 optimal path which uses the 2023 FES and ETYS data as inputs. The 50%, 90%, Economy RT and Security RT lines are based on FES 2024 and Clean Power 2030 pathways. The ETYS and NOA methodologies for this boundary are different and can result in different transfer capabilities.
The boundary capability is limited to 1.1 GW due to a thermal constraint on Beauly - Shin 132kV circuit.
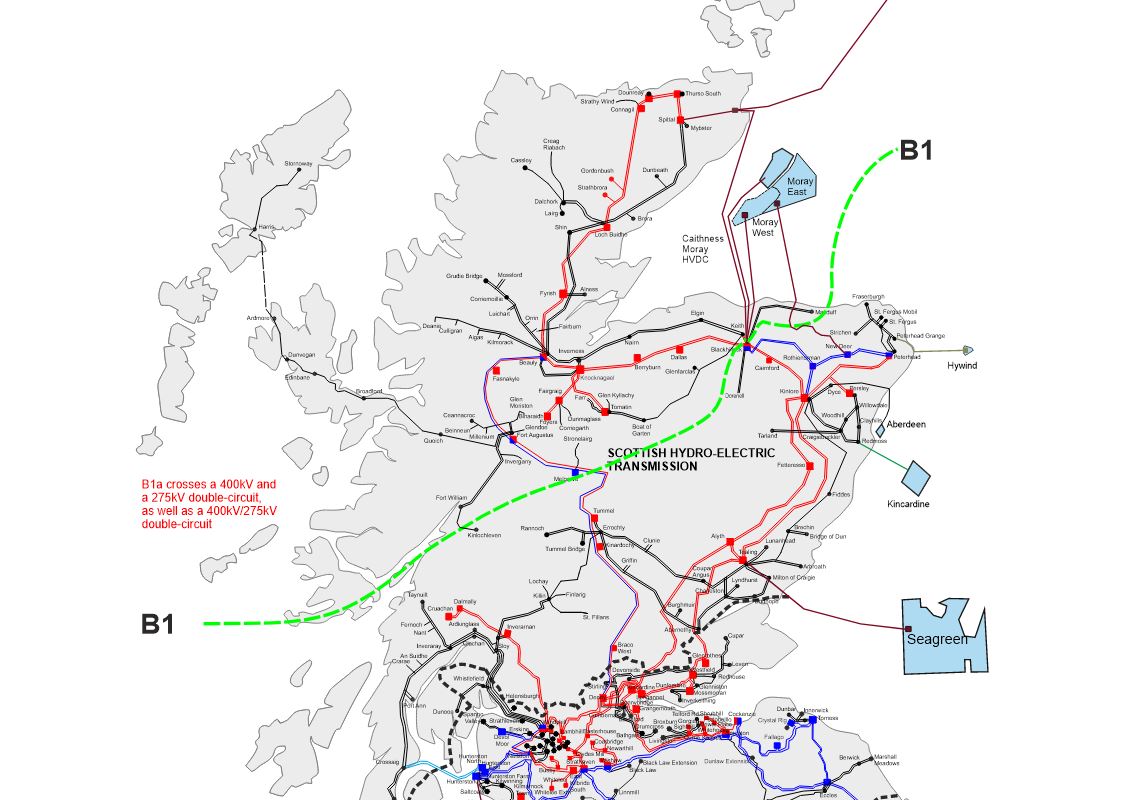
New renewable generation connections north of the boundary are expected to result in a significant increase in export requirements across the boundary, especially along the Beauly – Denny circuit.
In all FES, there is an increase in the power transfer through B1a due to the large volume of renewable generation connecting north of this boundary. Contracted generation behind boundary B1a includes the renewable generation on the Western Isles, Orkney and the Shetland Isles with a considerable volume of large and small wind developments both onshore and offshore. Future connection of new pumped storage assets in the North-West of the country is planned.
Beyond 2035, we see a decrease in expected transfers in the Holistic Transition and Hydrogen Evolution pathways. This is due to increasing demand in the north of Scotland whilst generation capacity remains relatively flat post-2035.
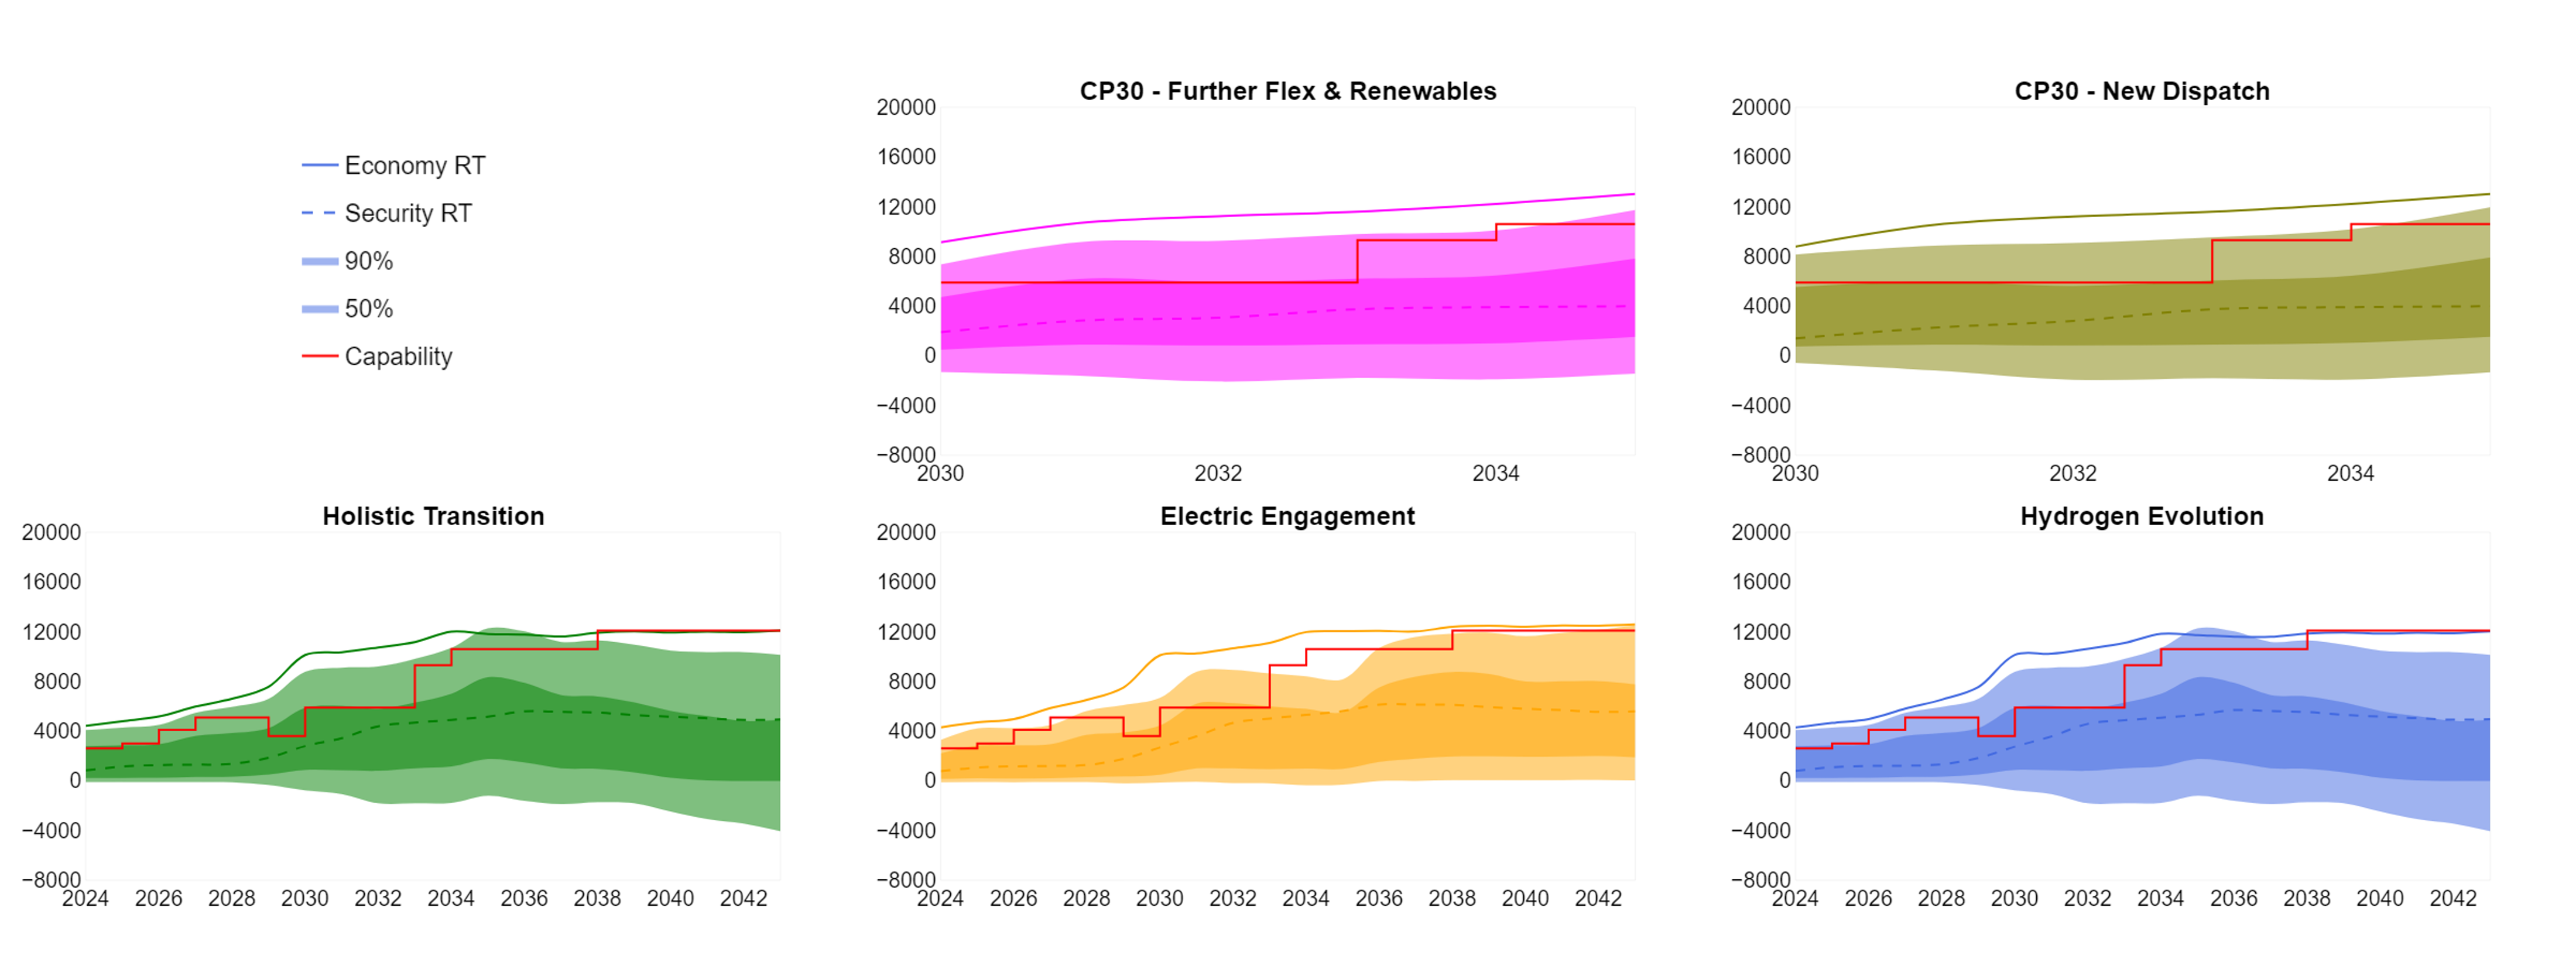
Boundary flows and base capability
View an interactive version of the graph
The capability line (in red) is based on the recommendations from the Beyond 2030 optimal path which uses the 2023 FES and ETYS data as inputs. The 50%, 90%, Economy RT and Security RT lines are based on FES 2024 and Clean Power 2030 pathways. The ETYS and NOA methodologies for this boundary are different and can result in different transfer capabilities.
The boundary capability is limited to 2 GW due to thermal constraint on the Tummel - Errochty 132kV circuit.
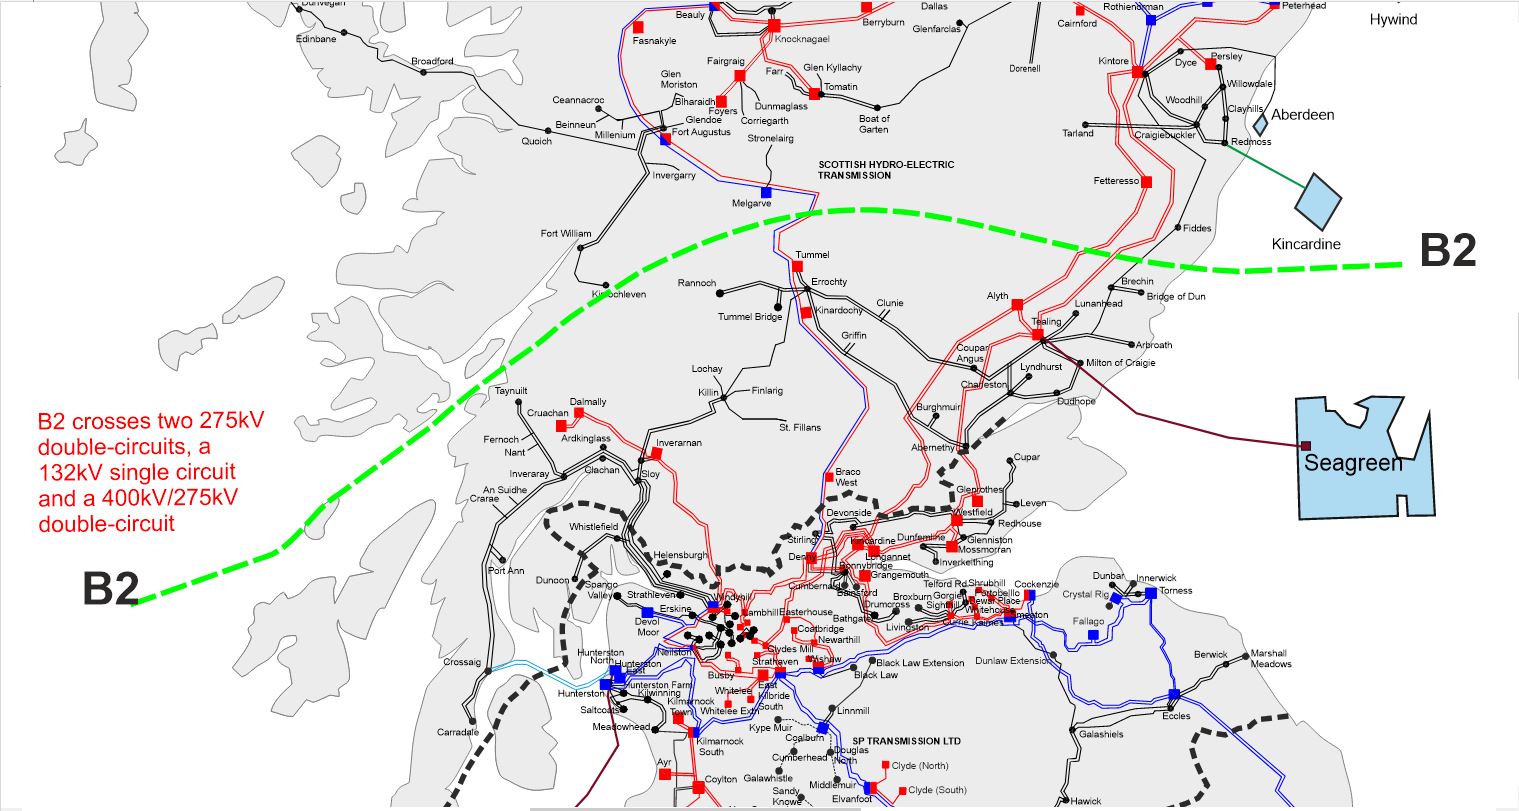
The generation behind boundary B2 includes both onshore and offshore wind, with the potential for additional pumped storage. Thermal generation lies between boundaries B1a and B2, as do several offshore windfarms.
The potential future boundary transfers for boundary B2 are increasing at a significant rate because of the high volume of renewable generation to be connected to the north of the boundary. This increased generation capacity will drive increasing power flows down the east coast 275kV circuits.
The increase in the required transfer capability for this boundary across all generation scenarios, with expected flows being above capability, indicates the strong potential need to reinforce the transmission system.
Boundary flows and base capability
View an interactive version of the graph
The capability line (in red) is based on the recommendations from the Beyond 2030 optimal path which uses the 2023 FES and ETYS data as inputs. The 50%, 90%, Economy RT and Security RT lines are based on FES 2024 and Clean Power 2030 pathways. The ETYS and NOA methodologies for this boundary are different and can result in different transfer capabilities.
The boundary capability is limited to 2.9 GW due to thermal constraint on the Tummel - Errochty 132kV circuit.
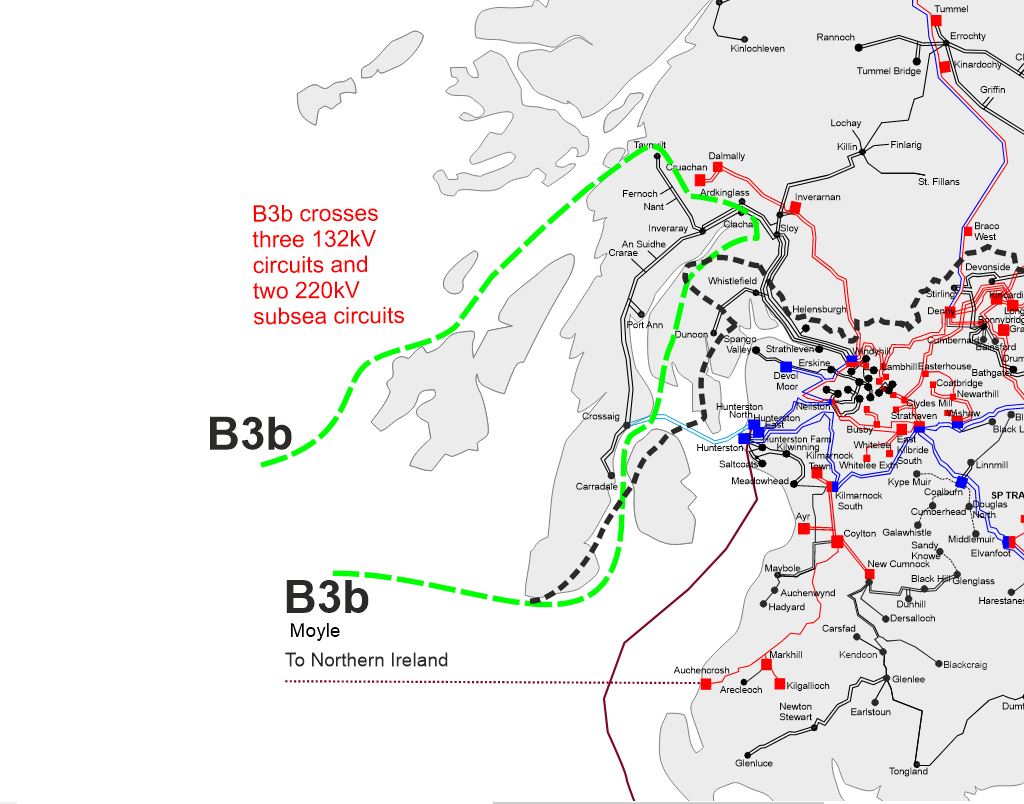
The generation within boundary B3b includes both onshore wind and hydro generation, with the prospect of further onshore wind generation being connected in B3b in the future, triggering the requirement for future reinforcement of this network.
B3b is not currently subject to NOA reinforcement options as current contracted enabling works for customer connections will increase the ability to export power from this region, effectively splitting the network in the south west and altering the boundary.
Boundary flows and base capability
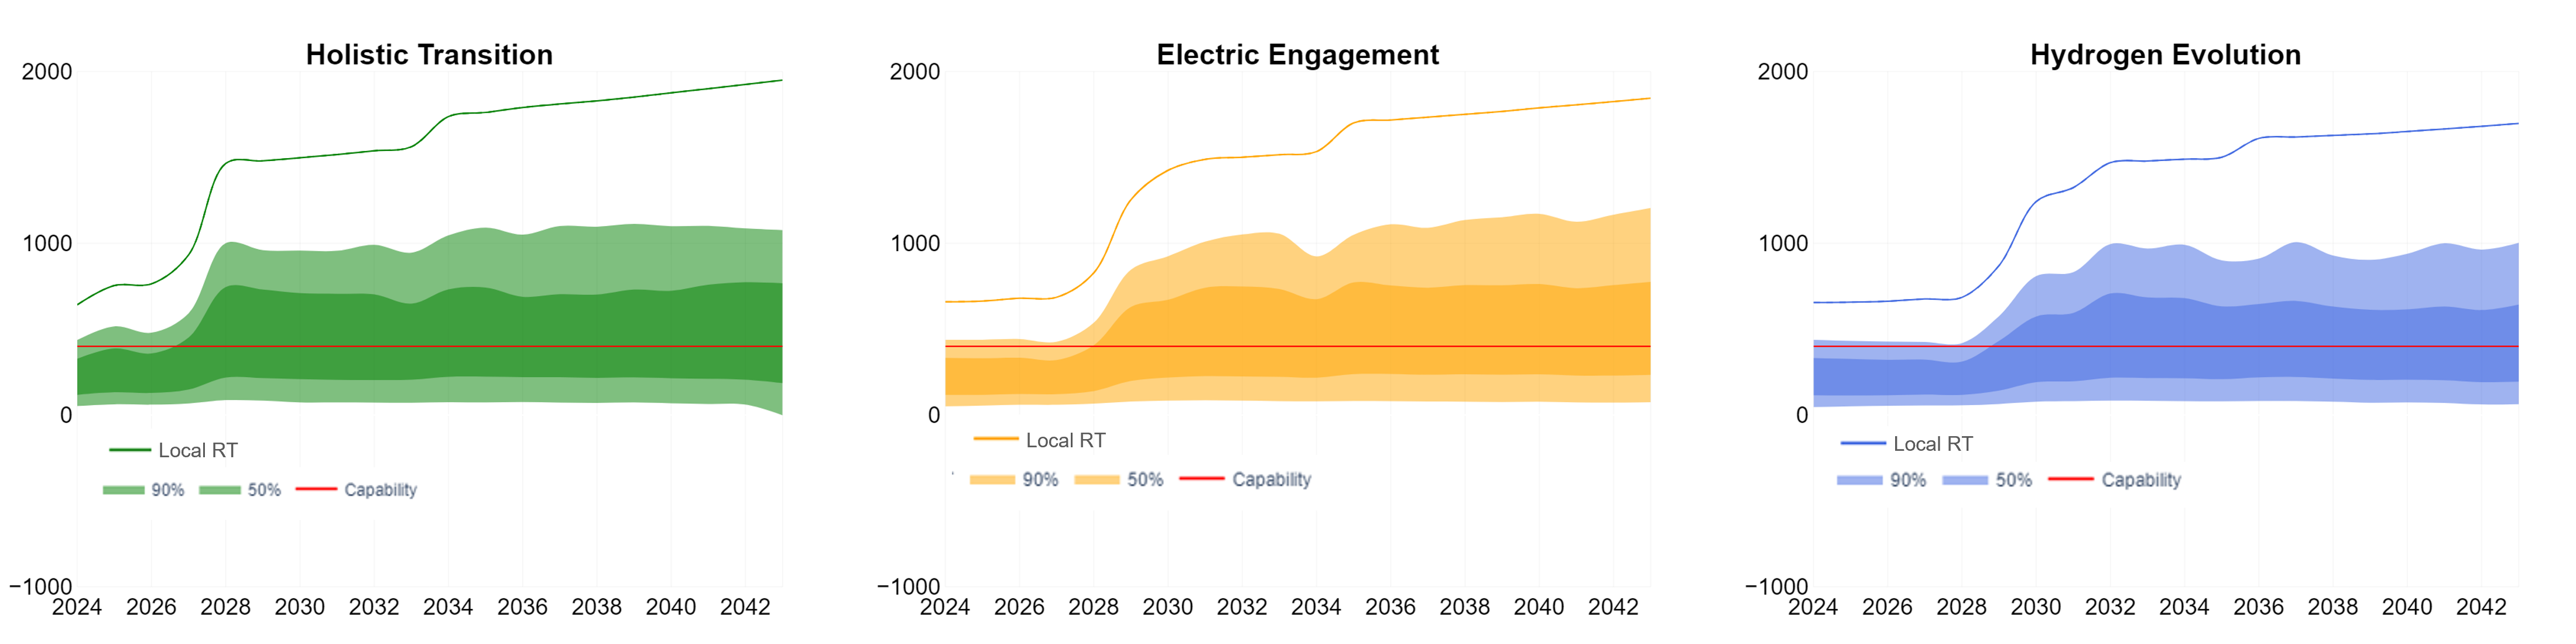
View an interactive version of the graph
The capability line (in red) is based on the recommendations from the Beyond 2030 optimal path which uses the 2023 FES and ETYS data as inputs. The 50%, 90%, Economy RT and Security RT lines are based on FES 2024. The ETYS and NOA methodologies for this boundary are different and can result in different transfer capabilities.
The boundary capability is limited to 0.45 GW due to thermal constraint on the Crossaig - Hunterston 220kV circuit.
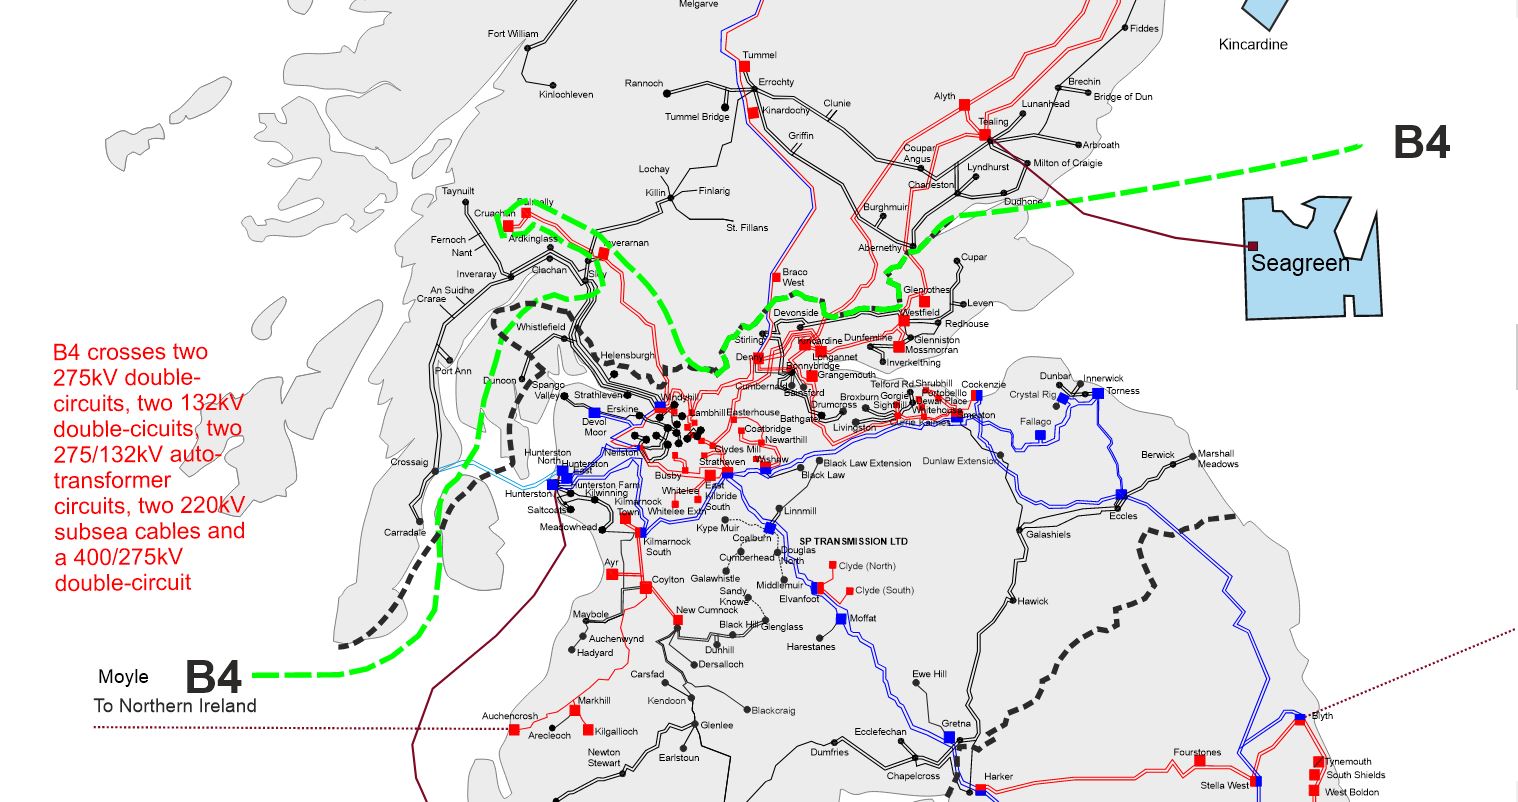
With increasing generation and potential interconnectors in the SSEN Transmission area for all scenarios, the required transfer across boundary B4 is expected to increase significantly over the next decade.
Across all FES, power transfer through B4 boundary increases due to significant generation connecting north of the boundary, including all generation above boundaries B0, B1a, B2, and B3b. This is primarily onshore and offshore wind generation, with the prospect of significant further offshore wind and storage being connected in the longer term.
Boundary B4 has a range of planned reinforcements as recommended by Beyond 2030 which will increase boundary capability; significant constraint costs have been incurred in the past year in this area of the network due to ongoing asset outages as some of these works take place. A potential opportunity for a new Constraint Management Intertrip Service has been identified for Central Scotland and NESO is working with Transmission Owners to understand the potential value for consumers.
Boundary flows and base capability
View an interactive version of the graph
The capability line (in red) is based on the recommendations from the Beyond 2030 optimal path which uses the 2023 FES and ETYS data as inputs. The 50%, 90%, Economy RT and Security RT lines are based on FES 2024 and Clean Power 2030 pathways. The ETYS and NOA methodologies for this boundary are different and can result in different transfer capabilities.
The boundary capability is limited to 4 GW due to thermal constraint on the Tealing - Westfield 275kV circuit.
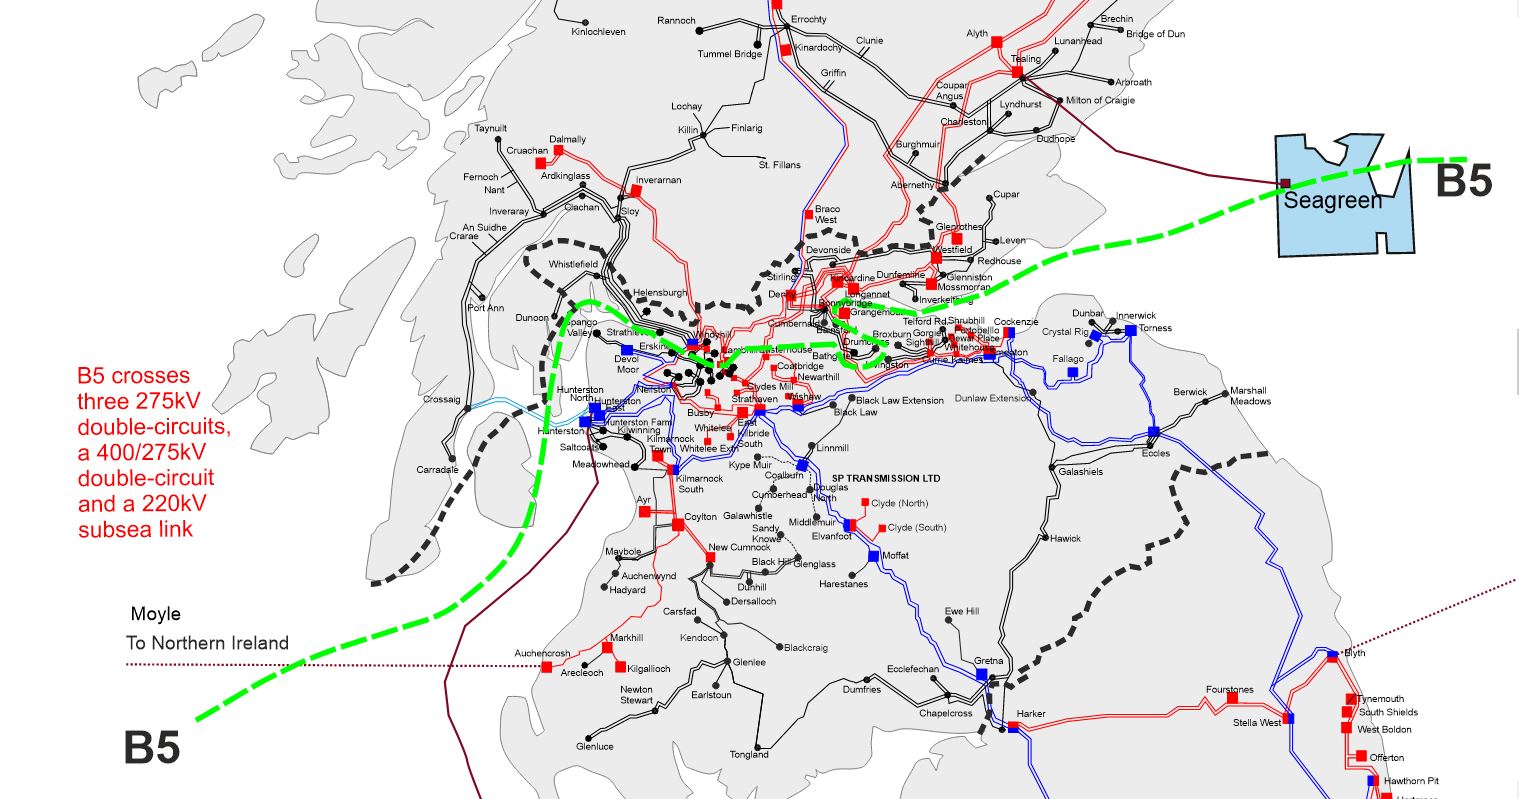
Across all FES, the power transfer through boundary B5 increases because of the significant volumes of generation connecting north of the boundary, including all generation above boundaries B0, B1a, B2 and B4. This is primarily onshore and offshore wind generation.
Boundary flows and base capability

View an interactive version of the graph
The capability line (in red) is based on the recommendations from the Beyond 2030 optimal path which uses the 2023 FES and ETYS data as inputs. The 50%, 90%, Economy RT and Security RT lines are based on FES 2024 and Clean Power 2030 pathways. The ETYS and NOA methodologies for this boundary are different and can result in different transfer capabilities.
The boundary capability is limited to 3.9 GW due to thermal constraint on the Denny North-Lambhill 275kV circuit.
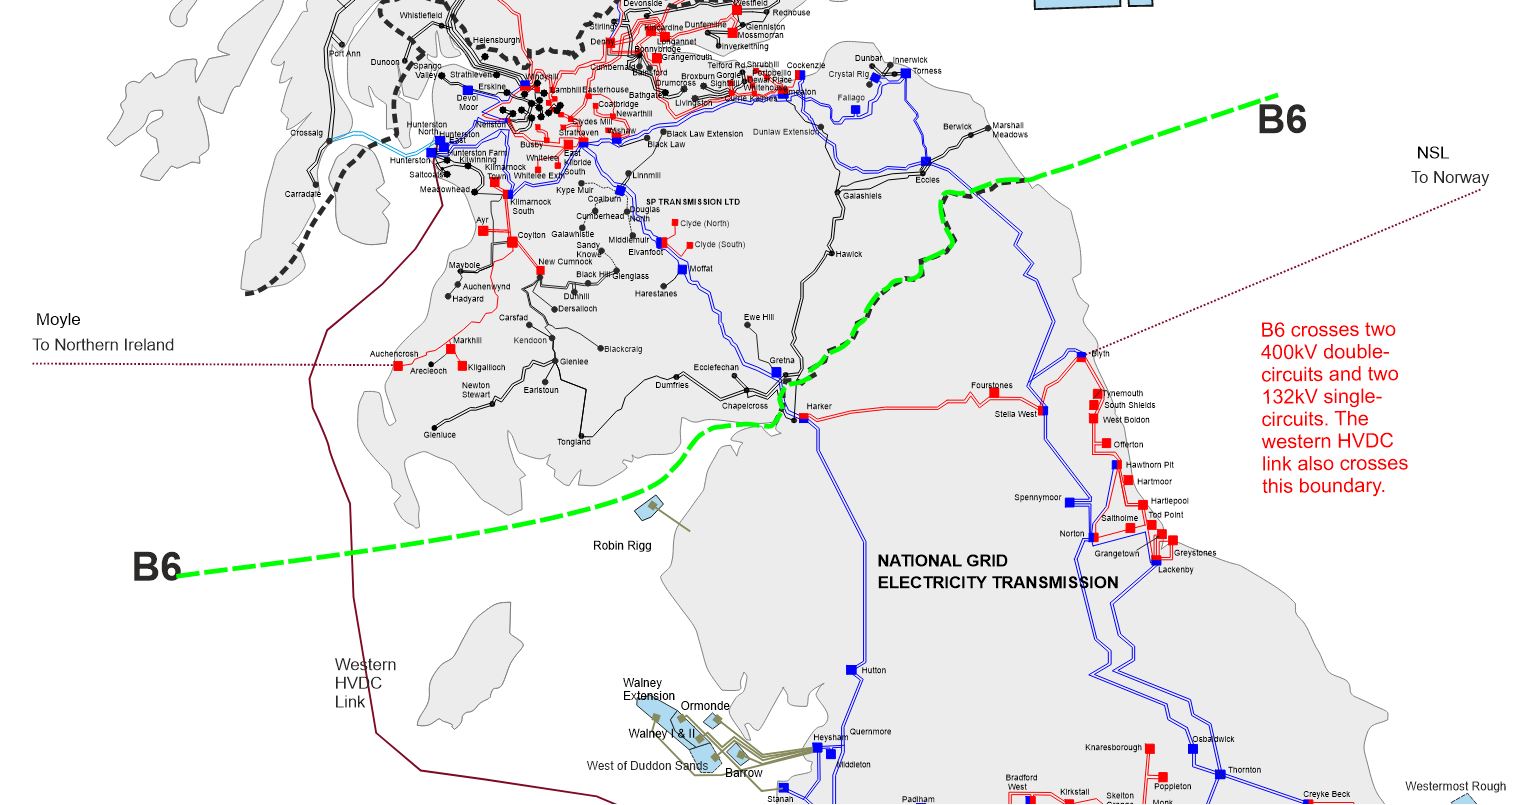
Across all FES, there is an increase in the power transfer requirements from Scotland to England due to the connection of additional generation in Scotland, primarily onshore and offshore wind.
With the FES including many wind farms in Scotland, the spread of boundary power flows is very wide due to the variable nature of wind generation. During periods of low generation output in Scotland, it is credible to have power flowing from south to north feeding Scottish demand.
The magnitude of the south to north power flows is low compared to those in the opposite direction so network capability is sufficient to support those conditions. While the south to north transfer capability is enough to meet demand in Scotland, it is still necessary for synchronous plant capability to remain in service in Scotland to maintain year-round secure system operation.
A sub-component of the project WCN2, one of the network reinforcements crossing B6 and recommended in Beyond 2030, was recently requested by NESO to be the first project to be competitively tendered through onshore early competition.
Boundary flows and base capability
View an interactive version of the graph
The capability line (in red) is based on the recommendations from the Beyond 2030 optimal path which uses the 2023 FES and ETYS data as inputs. The 50%, 90%, Economy RT and Security RT lines are based on FES 2024 and Clean Power 2030 pathways. The ETYS and NOA methodologies for this boundary are different and can result in different transfer capabilities.
The boundary capability is limited to 6.7 GW due to thermal constraint on the Harker-Moffat 400kV circuit.