North of England boundaries
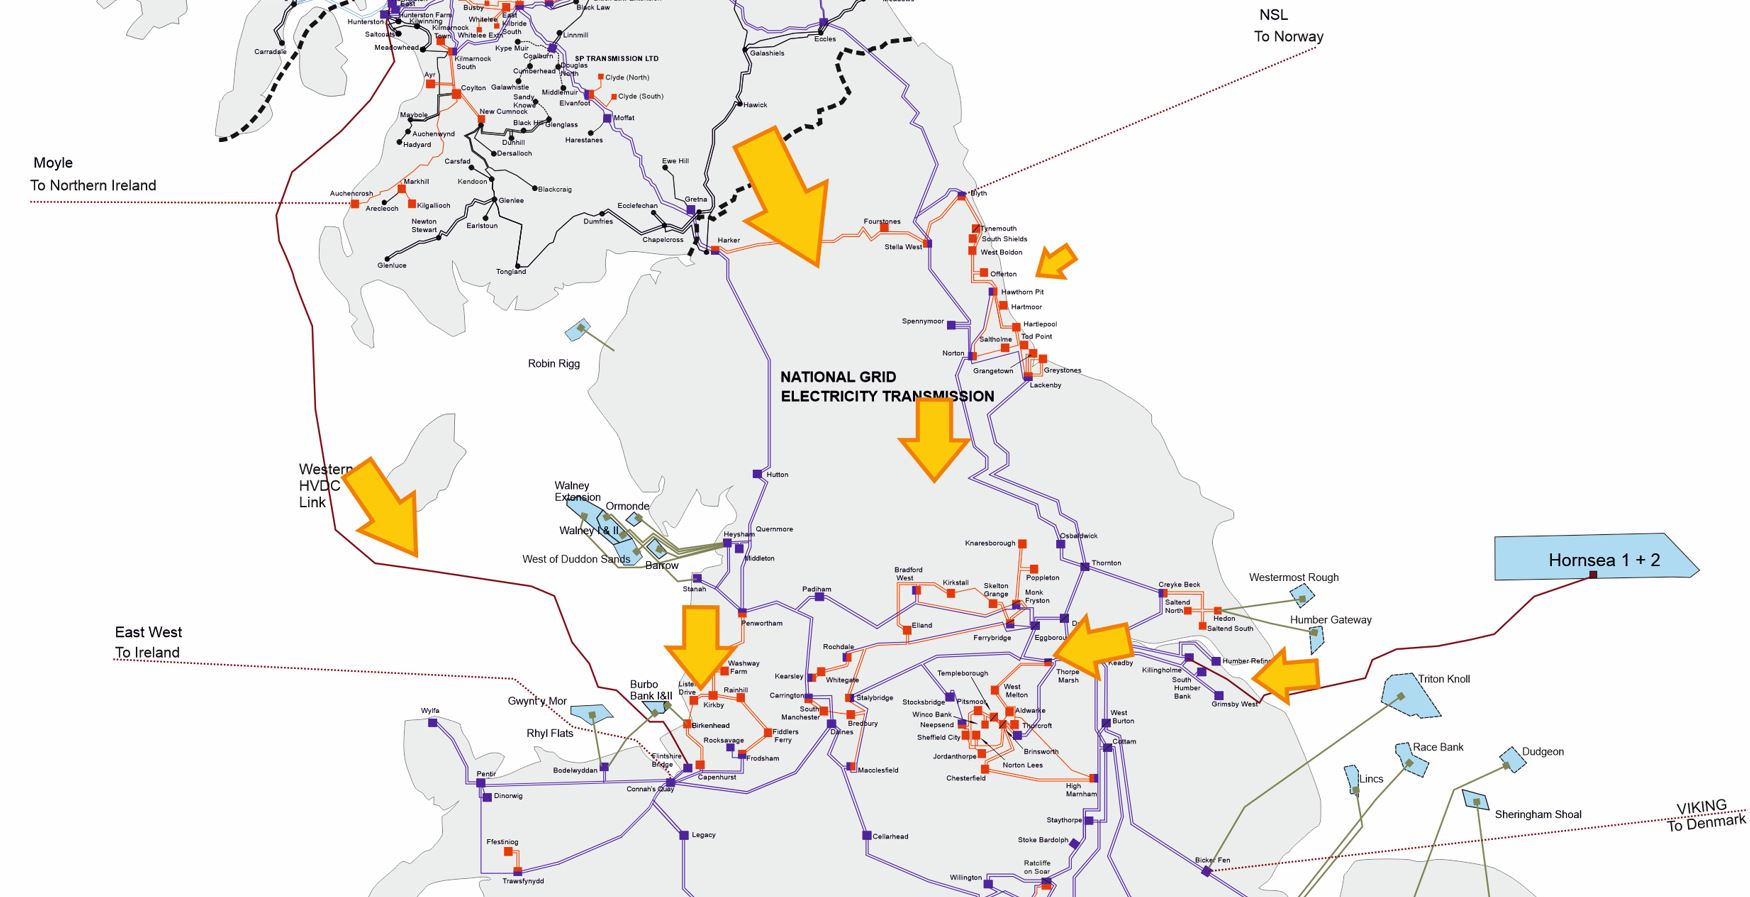
The North of England transmission region includes the network between the Scottish border and the North Midlands.
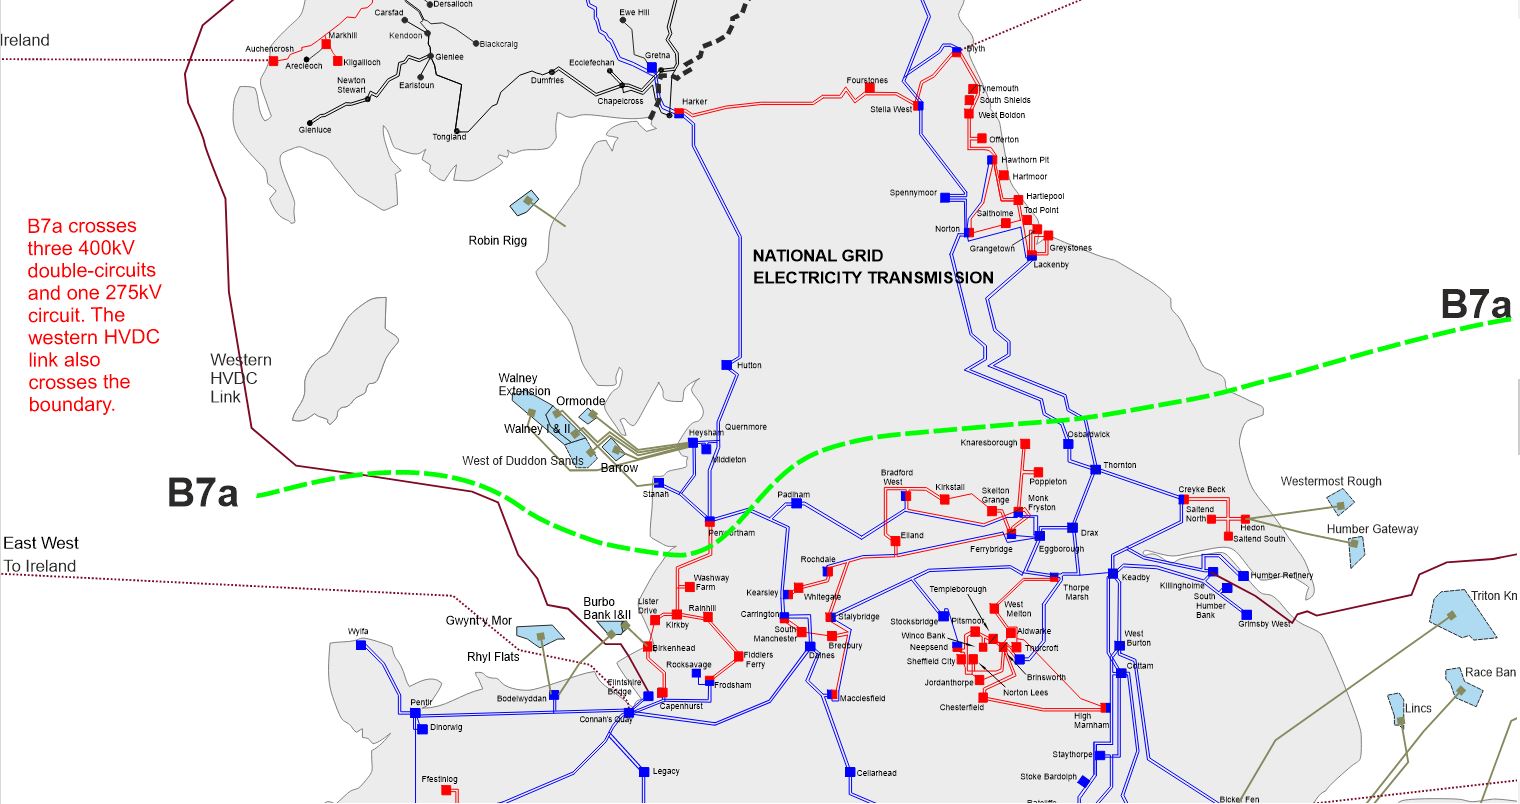
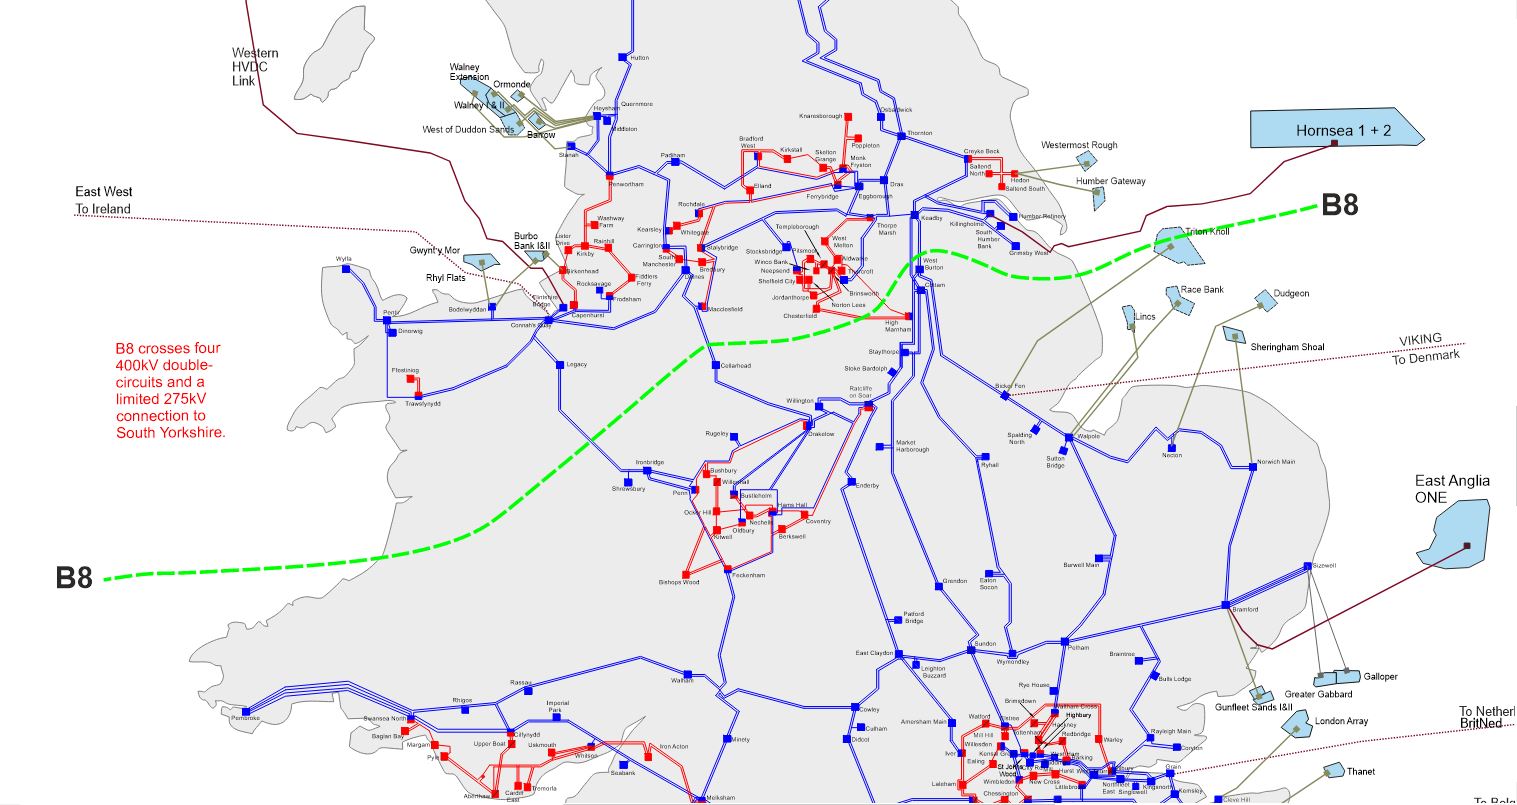
Boundaries B7a and B8 are in this region.
The map below shows the general pattern of power flow directions expected to occur at winter peak in the years to come up to 2036, i.e. power will generally flow from north to south. The arrows in the diagram illustrate power flow directions and are approximately scaled relative to the winter peak flows.
Regional drivers
Presently, most of the transmission network in the North of England is oriented for GB-wide North-South power flows. The significant projected increase of generation capacity in Scotland - is expected to drive transmission network requirements in the North of England.
The North of England is a heavily power-exporting region (the generation capacity far outstrips demand) and must also manage power flows from Scotland to demand centres in the Midlands and South. When wind generation is high, power will travel North to South, mostly coming from internal boundary generation and generators in Scotland.
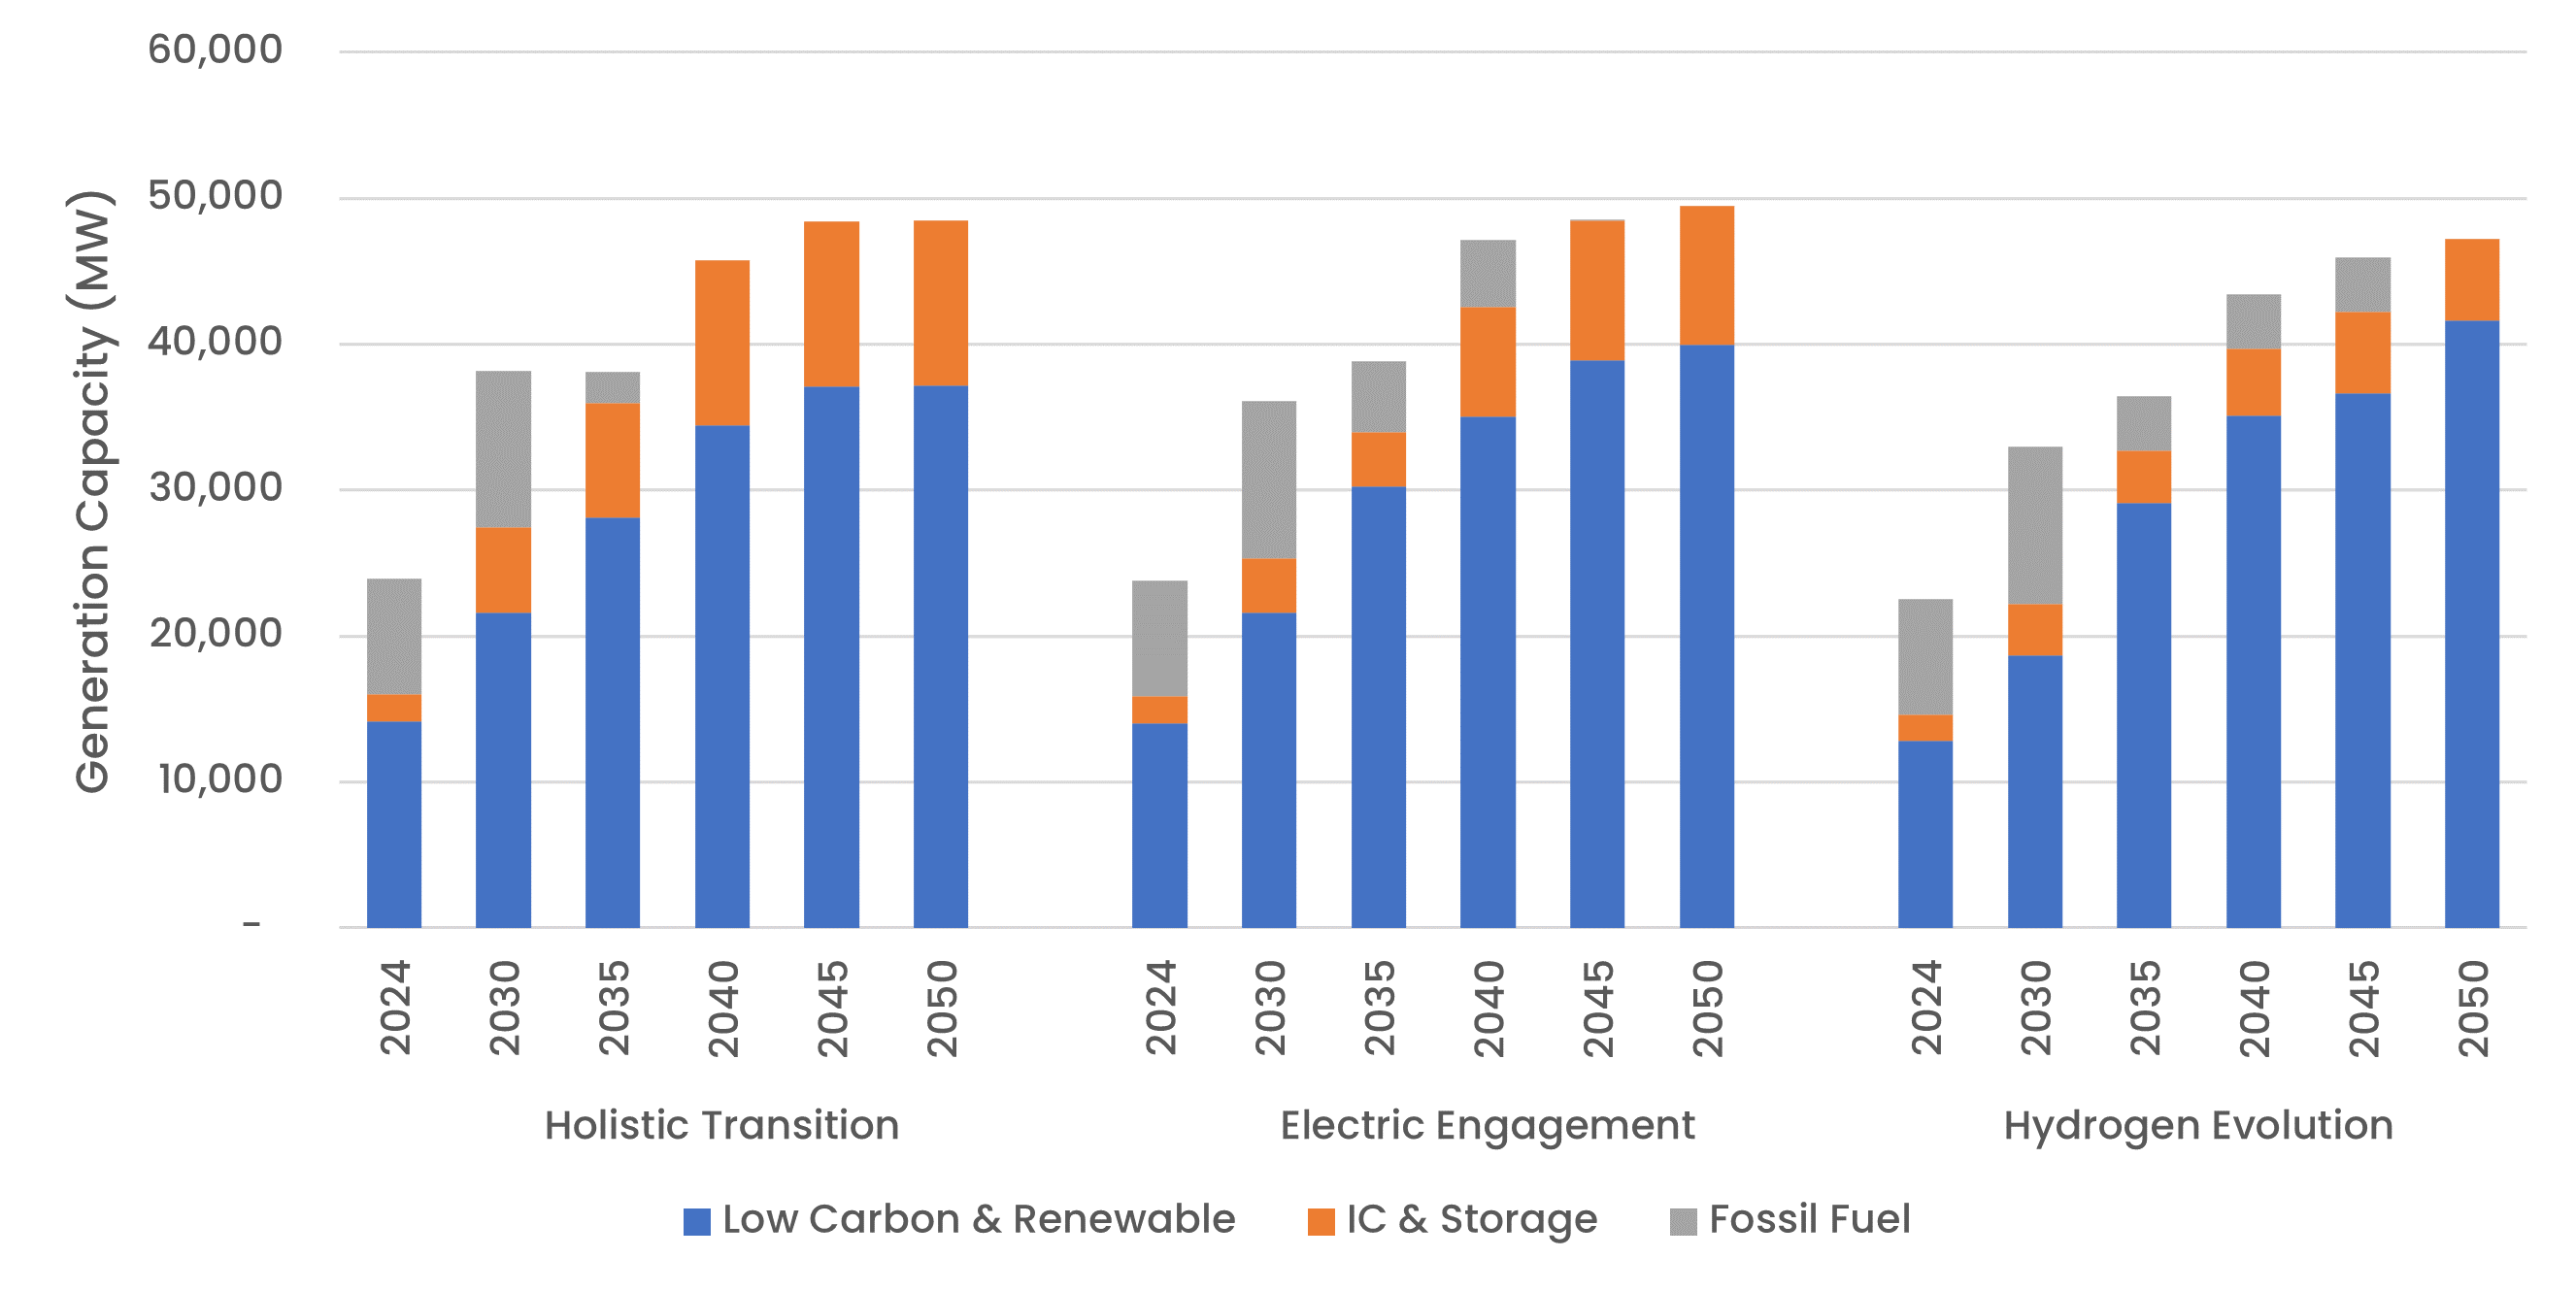
When most of this area and Scotland is generating power, the transmission network can become highly overloaded. The loss of one of the north-to-south routes can lead to constraints on the remaining circuits here. Low-carbon and renewable generation is expected to increase across all 3 FES pathways while fossil fuel generation could see sustained decline, but it wouldn’t be phased out in the region until 2040 at the earliest, in the Holistic Transition pathway.
Generation Capacity
Gross Demand
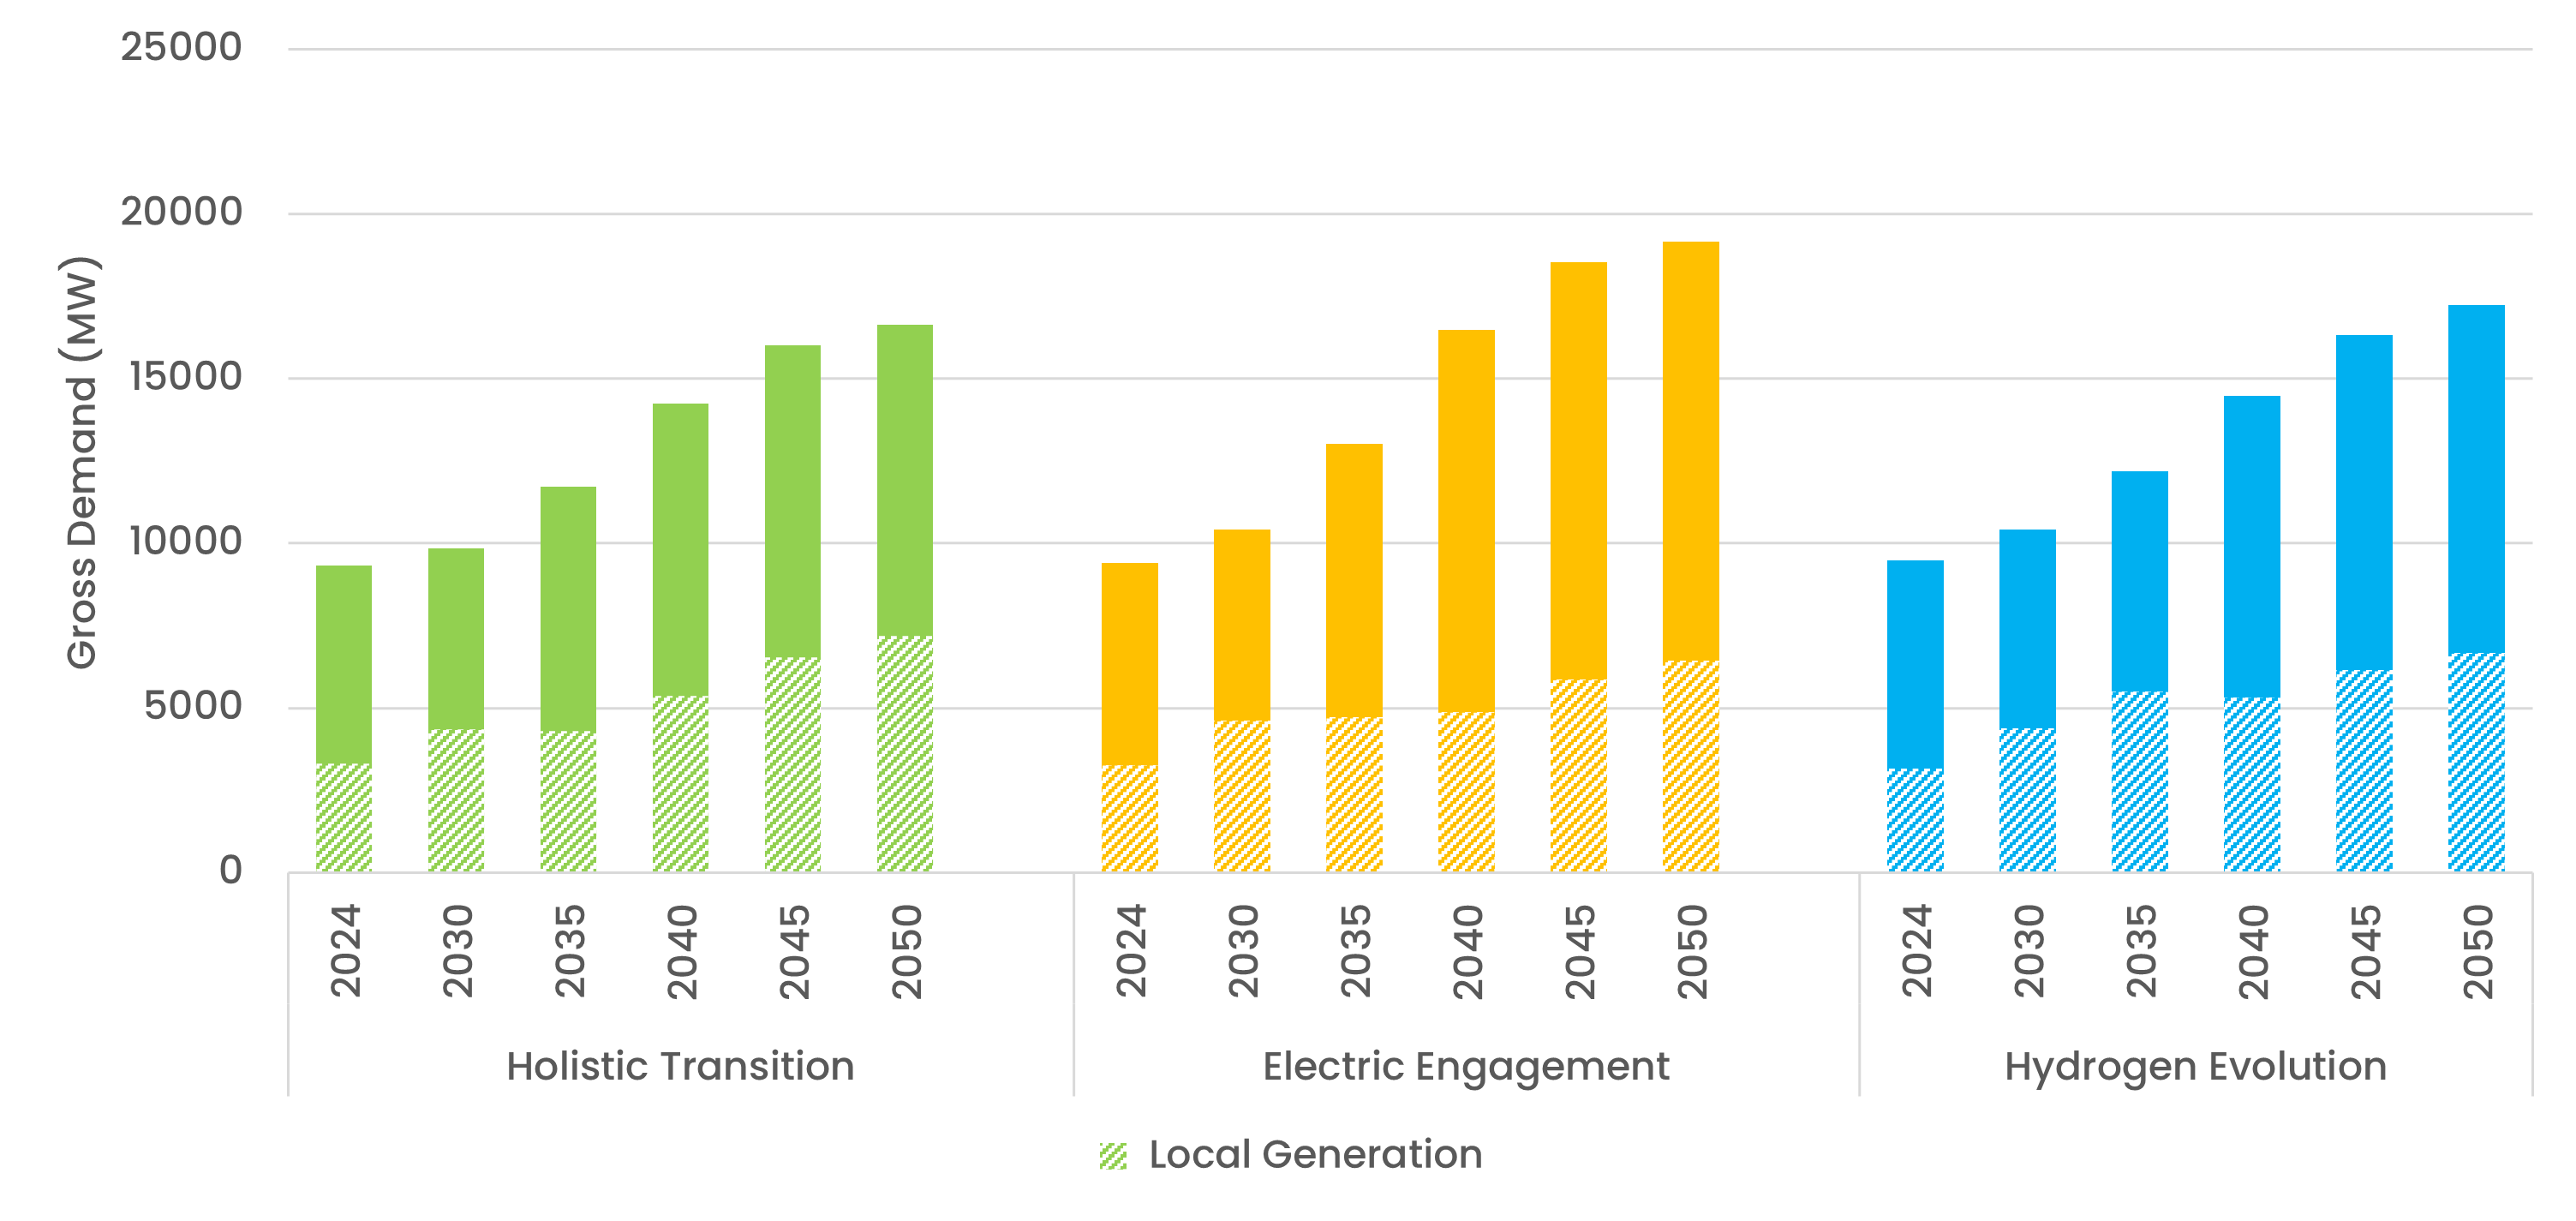
Overall, by 2030, the generation capacity in the region could increase to a total of over 33GW across all pathways. Gross demand in the North of England is expected to increase to a total of 10GW or more by 2030. All three pathways show a steady increase in the gross demand and a further 3-4GW of local embedded generation by 2050, with 3.5GW currently connected.
More local generation in this region would result in a reduction in net demand causing even less of the North-South power flows through this region being absorbed by demand. This will lead to higher through flows from the North of England and Scotland to demand centres in the midlands and south, resulting in more transmission capacity requirements.
High voltages issues, due to the closure of traditional generators and prevalence of long transmission lines in the region, can occur under light-load conditions. The NESO’s Voltage 2026 tender recently procured significant capability to manage high-voltage issues, with delivery from 2026. During periods of high flows (especially during high winds), South Yorkshire could also experience low voltage issues.
Boundary Regions
Click on the regions below to expand the boundary and understand its capability and challenges.
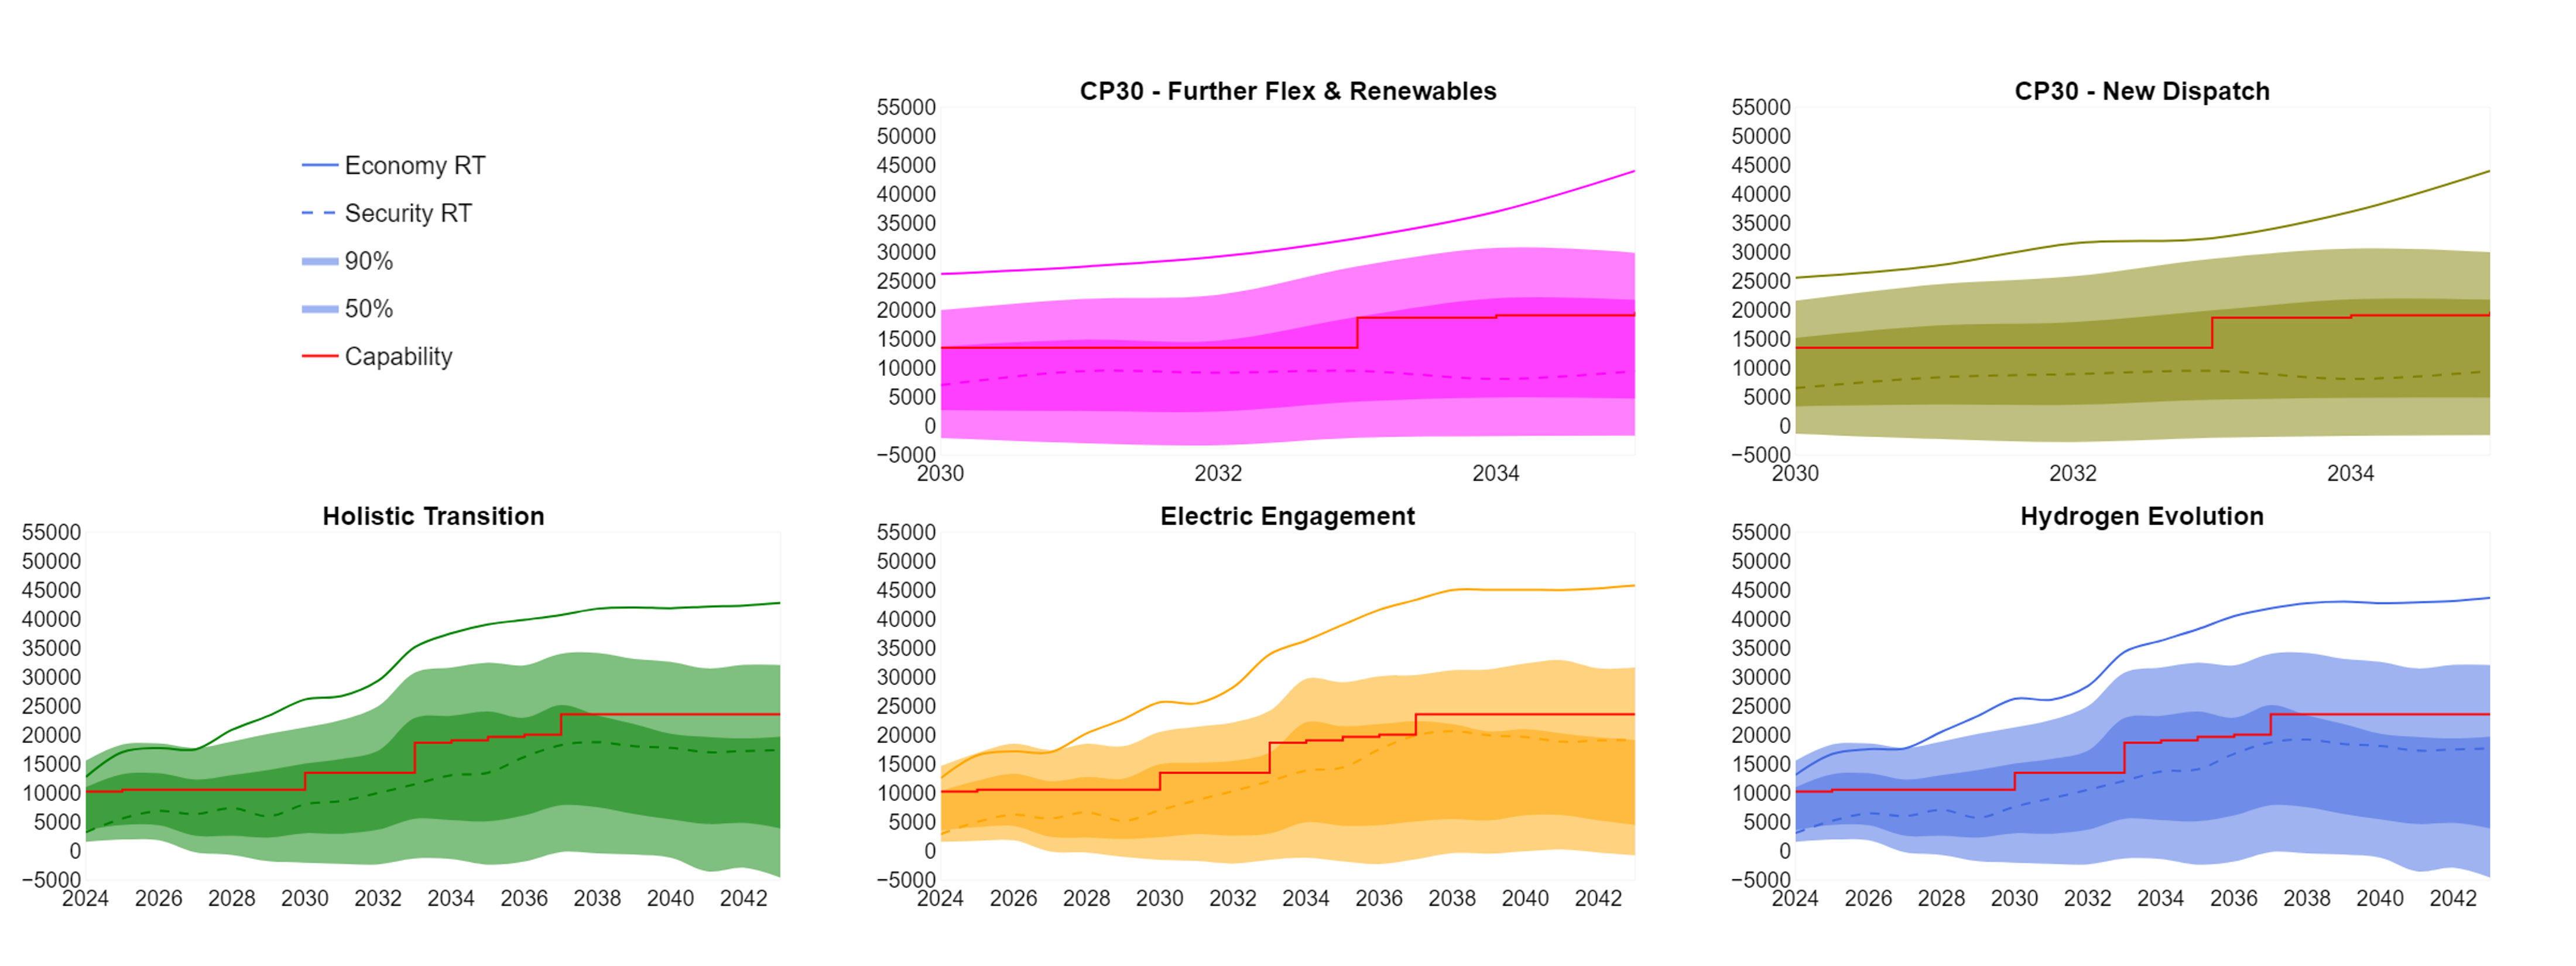
The graphs show a distribution of power flows for each of our Future Energy Scenarios, in addition to the boundary power transfer capability and NETS SQSS requirements for the next 20 years.
Each scenario has different generation and demand so produces different boundary power flow expectations. From applying the methodology in the NETS SQSS for wider boundary planning requirements (as discussed in the previous chapter), we determine for each scenario:
- The economy criteria - solid coloured line
- Security criteria - dashed coloured line
- Current and future NOA capability (where available) - solid red line
The capability line (red line) is based on the recommendations from the Beyond 2030 report. More information about the NOA methodology can be found here. The 50%, 90%, economy required transfer (RT) and Security RT are calculated from the 2023 FES and ETYS processes. Where the NOA transfer capability is not available, there is a red line that provides the transfer capability from ETYS 2022.
Note: Boundary capability line is affected by the generation and demand profiles within each FES background. Therefore, the graphs are provided for indicative purposes only and cannot be directly compared.
The calculations of the annual boundary flow are based on unconstrained market operation, meaning network restrictions are not applied. This way, the minimum cost generation output profile can be found. We can see where the expected future growing needs could be by looking at the power flows in comparison with boundary capability.

View an interactive version of the graph
On each graph, the two shaded areas provide confidence as to what the power flows would be across each boundary:
- The darker region shows 50% of the annual power flows
- The lighter region shows 90% of the annual power flows
From the regions, we can show how often the power flows expected in the region split by the boundary are within its capability (red line). If the capability of the boundary is lower than the two regions over the next 20 years, there might be a need for reinforcements to increase the capability. However, if the line is above the shaded regions, it shows that there should be sufficient capability here and that potentially no reinforcements are needed from a free market power flow perspective until the shaded regions exceed the capability (red line).
Across all FES, the SQSS economy required transfer and expected power flows are already beyond the present boundary capability. This suggests a strong need for network development to manage the increasing power flows.
The FES show a lot of variable renewable generation in the north, meaning the spread of boundary power flows is very wide. During periods with low northern generation output it is credible to have power flowing from south to north feeding northern demand.
Offshore wind contribute heavily to the increase in flows across B7a, multiple offshore developments are expected to connect onshore in Northern England - above B7a.
The Clean Power 2030 scenarios saw a decrease in expected transfers post-2030 when compared to the Holistic Transition scenario, with transfers around 2GW lower across both CP30 scenarios.
Boundary flows and base capability
View an interactive version of the graph
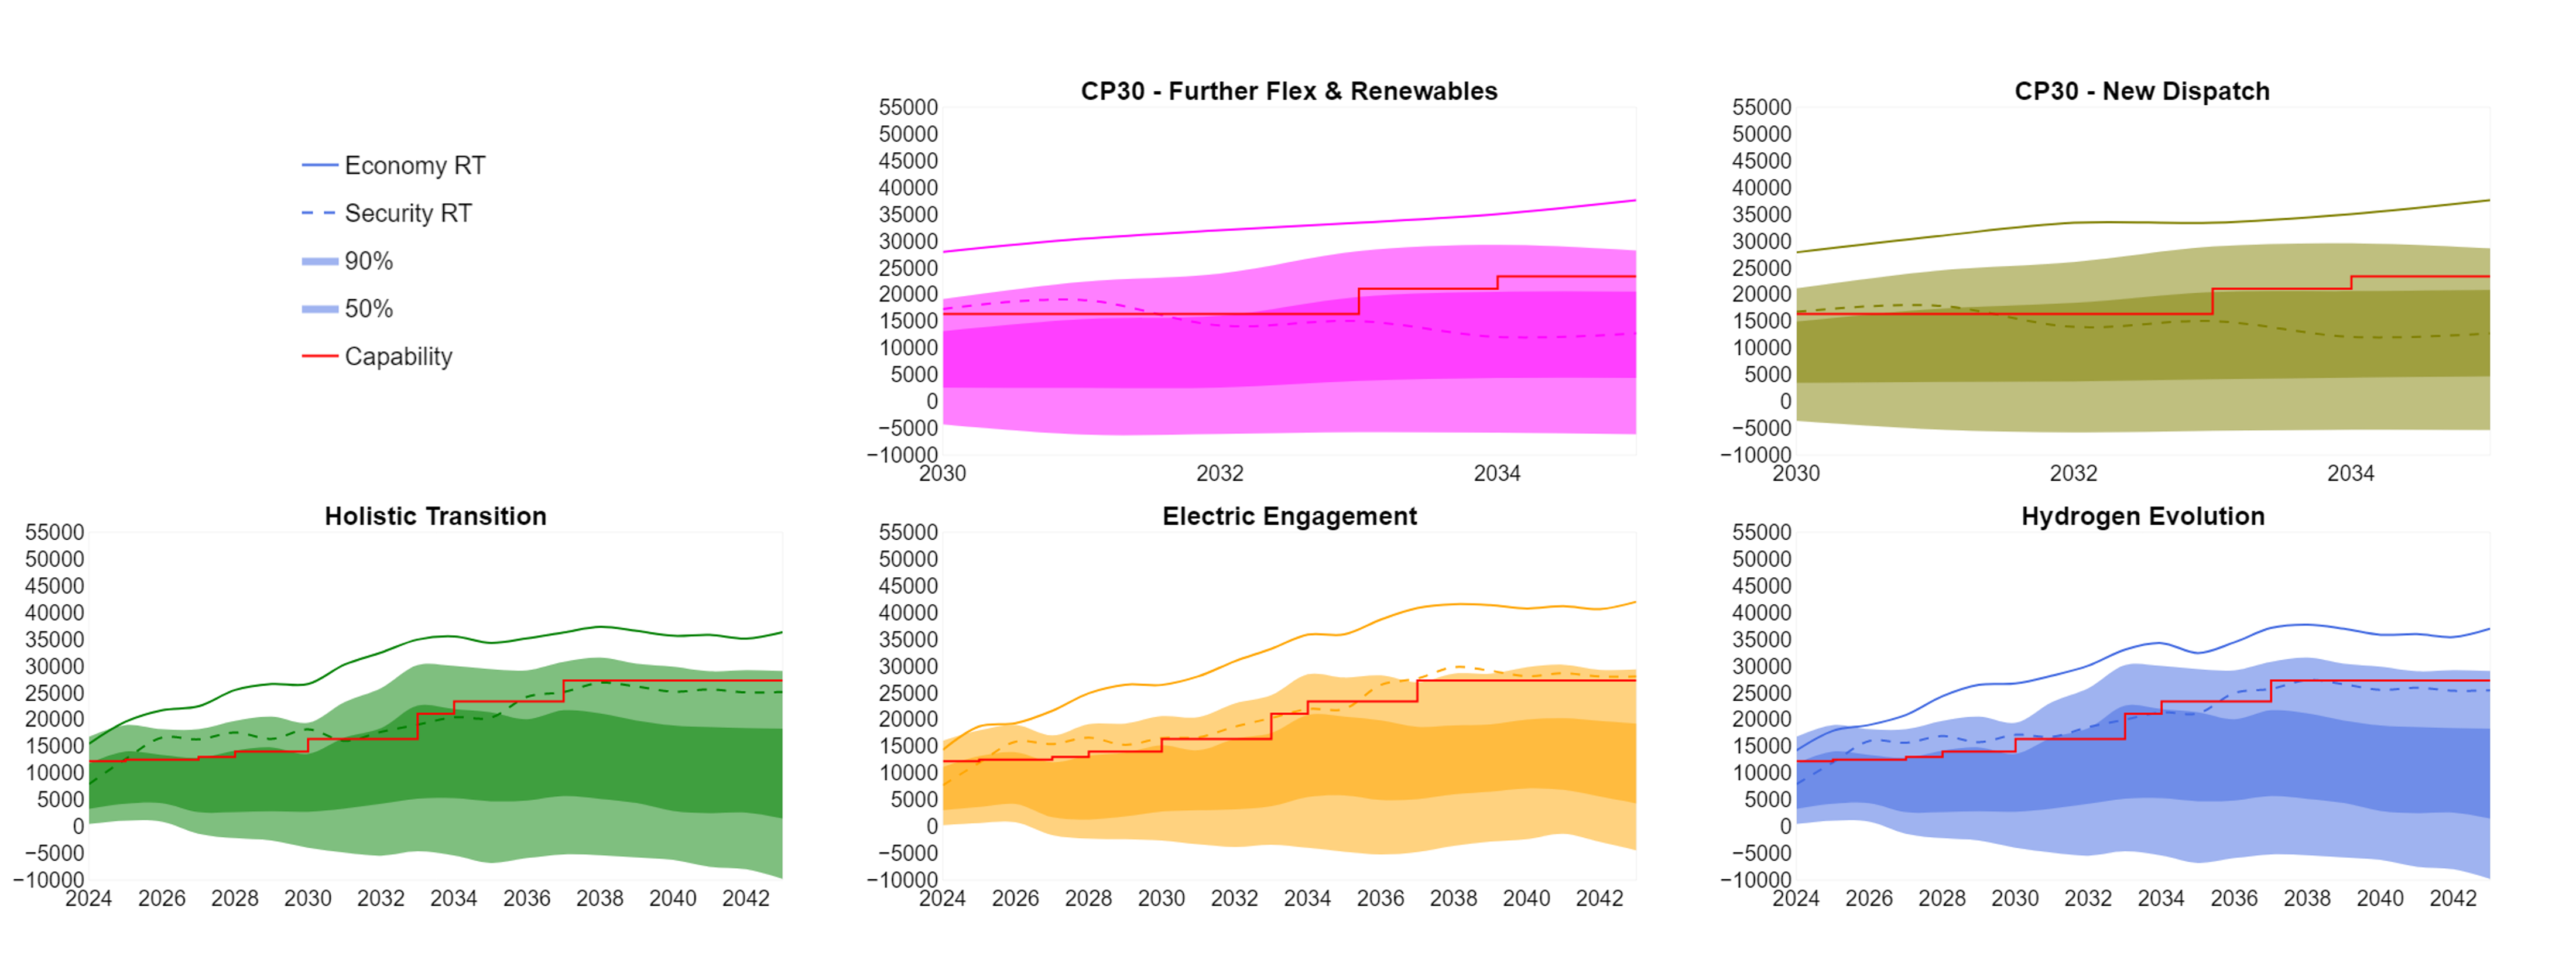
The capability line (in red) is based on the recommendations from the Beyond 2030 optimal path which uses the 2023 FES and ETYS data as inputs. The 50%, 90%, Economy RT and Security RT lines are based on FES 2024 and Clean Power 2030 pathways. The ETYS and NOA methodologies for this boundary are different and can result in different transfer capabilities.
The boundary capability is limited to 9.4 GW due to thermal constraint on the Penwortham – Washway Farm 275kV circuit.
For all scenarios in the FES, the SQSS economy required transfer and expected power flows quickly grow to beyond the present boundary capability. This suggests a strong need for network development to manage the increasing power flows.
Compared to the expected transfers calculated for ETYS 23, transfers are lower in ETYS 24 due to changing assumptions around the delivery dates for multiple offshore wind projects. Transfers across B8 from 2030 onwards are around 4GW lower in ETYS 24 than in ETYS 23, whilst expected flows are still higher than the capability.
Boundary flows and base capability
View an interactive version of the graph
The capability line (in red) is based on the recommendations from the Beyond 2030 optimal path which uses the 2023 FES and ETYS data as inputs. The 50%, 90%, Economy RT and Security RT lines are based on FES 2024 and Clean Power 2030 pathways. The ETYS and NOA methodologies for this boundary are different and can result in different transfer capabilities.
The boundary capability is limited to 11 GW due to thermal constraint on the Keadby – West Burton 400kV circuit.